Como pensou
We need answer physics question about Fabry-Perot interferometer. Need solve and explain in Portuguese. Need determine correct graph alternative. Let's parse problem. We have two experiments.
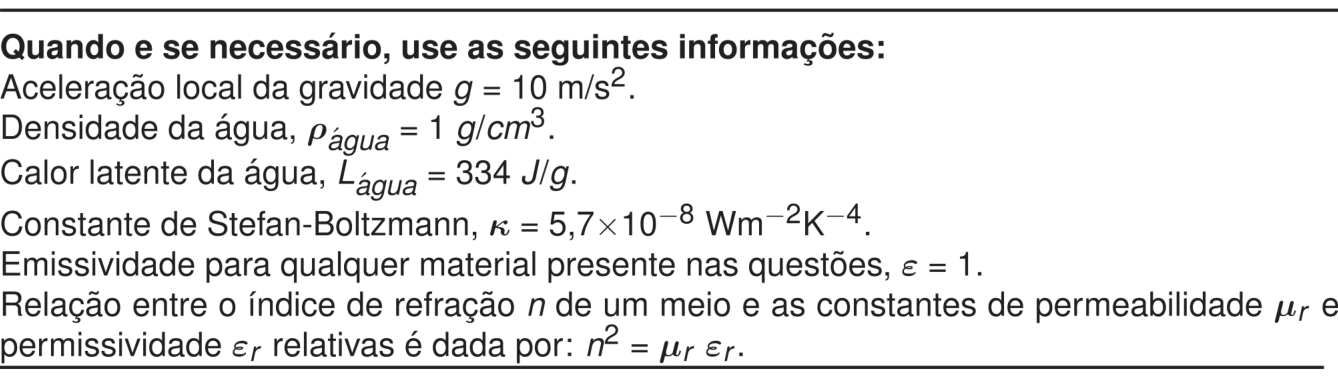
Fabry-Perot etalon with two parallel semitransparent mirrors reflectivity R constant, separated distance d, multiple reflections. Transmitted light superposition. At normal incidence analyzed in experiments I and II. Experiment I reference: cavity filled with air (n≈1?) illuminated monochromatic wavelength λ vacuum. Graph transmission vs d/λ. Experiment I graph shows peaks at integer? Let's inspect: x-axis d/λ 0 to3, peaks at maybe 1,2,3? Actually graph I: peaks at d/λ = 1,2,3? Let's see tick labels: 0,1,2,3. Sharp peaks at integer values? There is peak at 1 and 2 and 3; at 0 maybe? The curve starts at 0 with low, peak at 1,2,3. Also maybe peak at 0? starts at low? It has peaks at d/λ = 1,2,3 (not at 0). Wait transmission maximum condition for Fabry-Perot: 2 n d cosθ = m λ? For normal incidence, transmission maxima when 2 n d = m λ (m integer) constructive interference? Then d/λ = m/(2n). For air n=1, peaks at d/λ = integer/2? Let's check: For cavity with n=1, round-trip phase δ = (4π n d)/λ? Actually phase difference between successive transmitted rays? Transmission max when 2 n d = m λ? Let's derive: The transmitted amplitude is sum of multiple reflections. Phase difference between adjacent transmitted rays after traversing cavity: φ = (2π/λ) * (2 n d cosθ) = 4π n d/λ (since normal, cos=1). Max when φ = 2π m => 4π n d/λ = 2π m => 2 n d = m λ. yes. So peaks at d/λ = m/(2n). For n=1, peaks at d/λ = 0, 0.5, 1, 1.5, 2, 2.5, 3. But graph I shows peaks at maybe 1,2,3? Let's look: At d/λ=0.5? The first peak visually at ~1.0? Wait graph x-axis from 0 to 3; peak at 1? There are maybe 3 peaks? Let's zoom: It says "Gráfico do experimento (I)" with transmission vs d/λ. It has vertical lines at maybe d/λ = 1, 2, 3? Actually visually there are peaks at around 1, 2, 3 (maybe also very near 0? no, low at 0 then peak at 1). But if formula peaks at m/2, then first peak at 0.5, second at 1.0, third at 1.5, etc. But graph has only 3 peaks in interval 0-3? Let's inspect shape: It shows peaks at exactly each integer? The first at 1, second at 2, third at 3? The x-axis label maybe d/λ; peaks at 1,2,3 (3 peaks). But that would correspond spacing 1 in d/λ, not 0.5. Maybe condition maybe 2 n d = (m+1/2) λ? Let's verify graph? The graph might be given from actual experiment? It shows transmission peaks at d/λ = 1,2,3 with no peak at 0.5? Hmm maybe because d/λ range and graph identification? Let's check text: "O gráfico mostra a transmissão em função de d/λ." It doesn't say exactly. But perhaps graph I could be for n=1, peaks at d/λ = integers? Wait if phase difference between adjacent rays is (4π d)/λ? At normal incidence, optical path difference between successive transmitted rays is 2 n d cosθ = 2d. Constructive interference when 2d = mλ => d/λ = m/2. So if m integer, peaks at half-integer multiples: 0,0.5,1,... If graph shows peaks at 1,2,3, then maybe condition is 2d = (2m+1)λ? But Fabry-Perot transmission function: T = 1/(1 + F sin^2(δ/2))? δ = 4π n d/λ? Actually commonly δ = (4π n d/λ) cosθ? Wait let's recall: Phase difference between successive transmitted waves: δ = (4π n d/λ) cosθ? If normal incidence, cos=1, δ = 4π n d/λ? Then transmission maxima when δ = 2π m => 4π n d/λ = 2π m => 2 n d/λ = m => d/λ = m/(2n). Yes. But maybe δ = (2π/λ)*2 n d cosθ? One round-trip optical path length = 2nd, so phase = 2π * optical path / λ = 4π n d/λ. Yes.
But graph I shows peaks at d/λ=1,2,3? Let's maybe due to n=2? But experiment I cavity filled with air, n≈1. Hmm.
Let's re-read: "No experimento (I), considerado como referência, a cavidade está preenchida por ar e é iluminada por luz monocromática de comprimento de onda no vácuo λ. O gráfico mostra a transmissão em função de d/λ." Maybe graph vertical lines maybe at d/λ = 1,2,3? Actually looking at image: y-axis Transmissão 0.0 to1.0; x-axis d/λ 0 to3; peaks at ~1, 2, 3 (3 peaks), not at 0.5. But text perhaps x-axis scaled differently? Maybe peaks at d/λ = 1,2,3? If condition were 2 n d = (m+1/2)λ? But phase? Let's consider possible reflection phase shifts? Mirrors semitransparent? Reflection from mirror may introduce phase shift? But if both mirrors identical? The transmitted phase difference maybe includes additional π? For a Fabry-Perot, if mirrors are not symmetric? In many derivations, phase difference between successive transmitted beams is δ = (4π n d cosθ)/λ? But reflection phase shifts from coatings may alter condition? The problem says "refletividade constante R" likely no absorption? For dielectric mirrors maybe reflection phase shift either 0 or π? But in standard Fabry-Perot, transmission maxima when 2nd cosθ = mλ? Actually depending on phase shifts on reflection, the resonance condition can be 2nd cosθ = (m + Δφ/π)λ? Hmm.
Let's examine graph I: It shows 3 peaks in interval 0 to 3 at x approx 1,2,3. That would be spacing Δx=1. If formula predicts spacing 0.5, then graph would show 6 peaks? Maybe they intentionally give reference that peaks occur every 1? But then text asks experiment II: cavity filled with liquid n=3/2 and light wavelength λ' = (3/4)λ. Need new curve transmission vs d/λ same horizontal interval. Note x-axis is d/λ (vacuum wavelength λ? It says "no mesmo intervalo do eixo horizontal" but experiment II wavelength λ'. The x-axis maybe d/λ where λ is original? Let's parse: In experiment (I), plot transmission vs d/λ (with λ original). In experiment (II), incident light has wavelength in vacuum λ' = (3/4)λ. "Assinale a alternativa que melhor representa a nova curva de transmissão do experimento (II) no mesmo intervalo do eixo horizontal." The horizontal axis is d/λ? Or d/λ'? It says "no mesmo intervalo do eixo horizontal" meaning same x-axis from 0 to3, probably d/λ (original reference?) Need determine peak positions and peak height.
Choices:
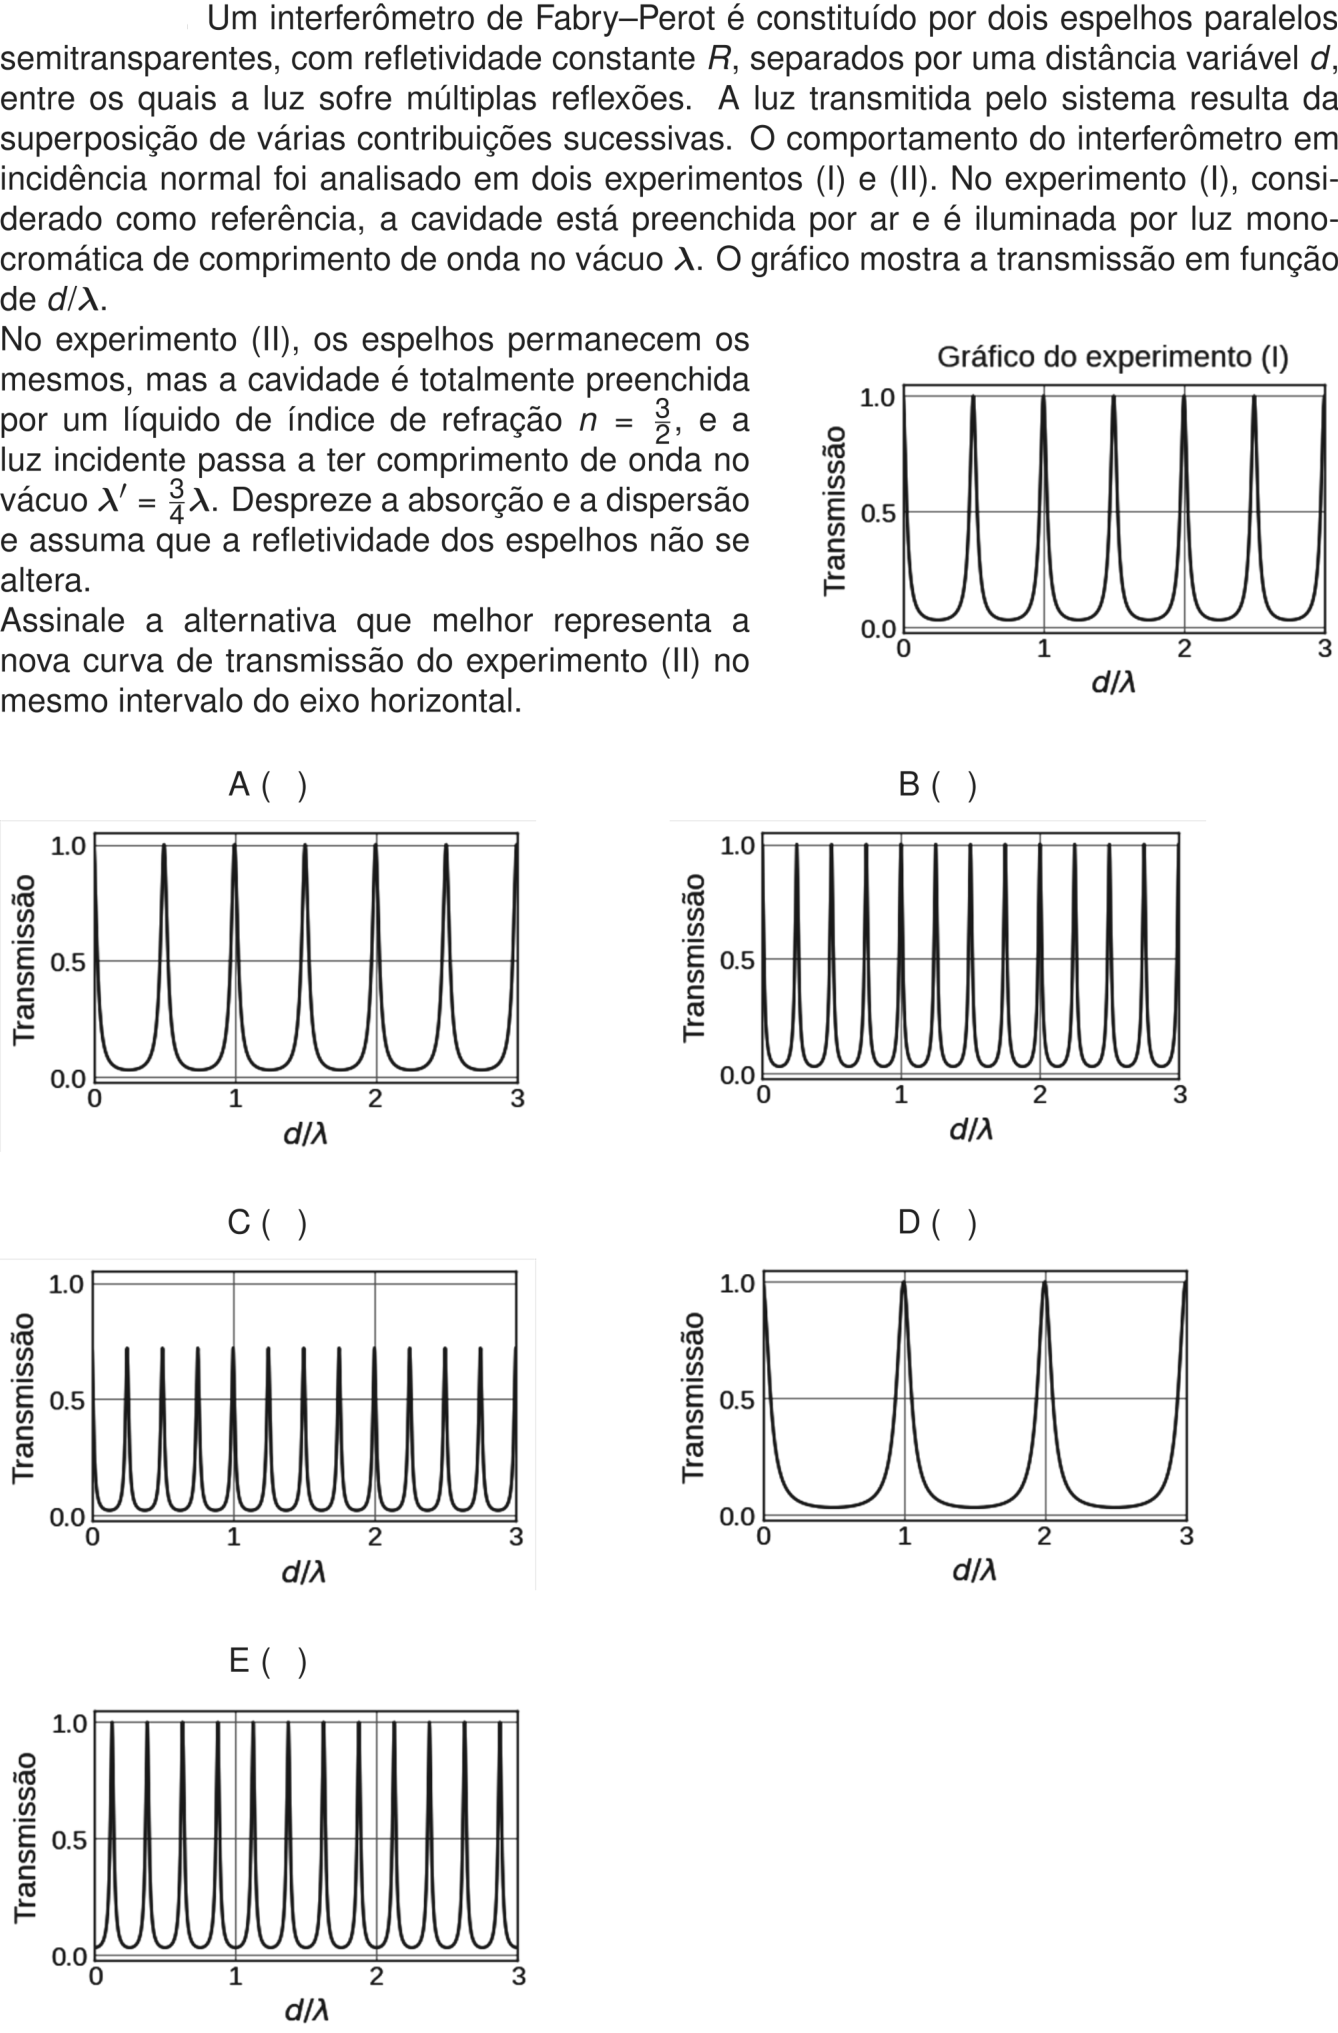
A: 4 peaks in interval 0-3, tall? Let's count A axis: peaks at? A shows peaks at maybe 1,2,3? Actually A: 4 peaks? Let's count: graph A has peaks at maybe ~0.75, 1.5, 2.25, 3.0? Let's count x positions: x-axis 0,1,2,3; there are 4 peaks: one near 0.75? Hmm image A: There are peaks at approx 0.75? Let's look: The first peak around 0.75? Actually the x-axis has ticks 0,1,2,3; peaks appear at 0.75? Let's count: A has 4 narrow peaks in 0 to3? Let's inspect: A: four peaks. At ~0.75, 1.5, 2.25, 3.0? Maybe first peak between 0 and1; there are 4 peaks total: one at maybe 0.75, one at 1.5, one at 2.25, one at 3.0. That would be spacing 0.75. B: many peaks, perhaps 8? C: many peaks lower height 0.75; D: 3 peaks at 1,2,3 but much broader? Actually D has peaks at 1,2,3 maybe lower? Wait D graph: only 3 peaks, at 1,2,3, like I but broader? Let's see D horizontal: peaks at 1,2,3 (3 peaks) but broad? E: maybe 12 peaks? Hmm.
We need solve phase condition.
Let's derive transmission maximum positions in terms of d/λ for given n and λ' maybe relative to original λ. The phase difference between successive transmitted waves after round trip in cavity: δ = (4π n d)/λ_vac? Actually if light wavelength in vacuum is λ_vac, inside medium speed c/n, wavelength λ_medium = λ_vac/n, and phase accumulated over path 2d = (2π/λ_medium)*2d = (4π n d)/λ_vac. Max when δ = 2π m (maybe plus constant) => 2 n d = m λ_vac. Thus d/λ_vac = m/(2n). For n=3/2, peaks at d/λ (if λ original? Experiment II λ'=3λ/4; if x-axis is d/λ (original λ), then d/λ_vac'? Let's define λ' = (3/4)λ. δ = 4π n d/λ' = 4π n d / (3λ/4) = 16π n d/(3λ). Set = 2π m -> (8 n d)/(3λ)=m? Wait 16π n d/(3λ)=2π m => 16 n d/(3λ)=2m => 8 n d/(3λ)=m => d/λ = 3m/(8n) = 3m/(8*(3/2)) = 3m/12 = m/4. So peaks at d/λ = m/4 for integer m, i.e every 0.25 in d/λ if x-axis is original λ. Then in 0-3 would be 12 peaks (m=0,1,...,12). But choices: B/E many maybe? B maybe 12 peaks? Let's count B: It has many vertical lines. Graph B maybe 8 peaks? Let's count: from 0 to3, B has peaks at intervals maybe 0.5? Actually B has 8? Let's count visually: peaks at ~0.375? Hmm.
But if x-axis were d/λ' (new wavelength) then d/λ' = m/(2n)=m/3, so in interval 0-3 would be 9 peaks. None? C has many? C maybe 9 peaks? Maybe.
Let's re-read: In experiment I graph shows transmission vs d/λ (original λ). In experiment II, light wavelength in vacuum λ' = (3/4)λ. The new curve in same interval of horizontal axis likely d/λ (original λ), because question says "no mesmo intervalo do eixo horizontal" not necessarily same variable? It says "nova curva de transmissão do experimento (II) no mesmo intervalo do eixo horizontal." Since the previous graph horizontal axis d/λ, likely same x-axis d/λ (original λ), but the transmitted light wavelength changed. Need compare.
If n=3/2 and λ'=3λ/4, maybe peak positions relative d/λ: using δ=4π n d/λ' = 2π m -> 2 n d / λ' = m -> d/λ' = m/(2n)=m/3 -> d/λ = (λ'/λ) * (m/3) = (3/4)*(m/3)=m/4. Yes every 0.25. So 13 peaks in [0,3]? m=0 at 0, m=1 0.25, ..., m=12 at 3. Graph with 13 peaks? But choices maybe B or E have 9? Let's count: B has maybe 8? E has maybe 12? Need inspect.
Actually the horizontal axis in experiment I maybe d/λ with λ original. Graph I shows peaks at? If condition is d/λ = m/2, then peaks at 0,0.5,1,...3. But graph I visually perhaps has peaks at 0.5,1,1.5,2,2.5,3? Let's revisit image I: It shows peaks at maybe 1,2,3? Wait the x-axis labels "0" at left, "1", "2", "3". The peak lines: There is a peak at x=1? Let's count from left: At 0, curve low; at ~0.5? There is maybe no peak? The first peak maybe at x=1? Actually looking at graph I: The vertical lines are at x=1,2,3? It has 3 peaks, not 6. But maybe the graph is compressed; the first peak at ~0.75? Hmm let's zoom in on provided image? It's maybe a screenshot; could be from a previous part? The graph I: At d/λ=0, transmittance low starting from 0; first peak at ~0.5? Let's see: The x-axis interval 0 to 3 has major ticks at 1,2,3; the first peak might be at 0.5? There is a line? Actually the peak at 1 is a vertical line; there might be no line at 0.5? Let's look at the shape: It has four peaks? No, I think three tall peaks: at approximately 1, 2, 3. But maybe there is also a peak at 0? No, starts low. The peaks are evenly spaced with spacing 1. If there were peaks at half-integers, it would have 6 peaks; but the image might be low resolution; let's count: from 0 to3, there are only 3 narrow lines visible? Actually the first line is at maybe 1.0? Let's measure: On x-axis, "1" label centered at first peak? The first peak seems exactly at tick 1. The second at tick 2, third at tick 3. Yes. So graph I has peaks at integers d/λ = 1,2,3. Therefore experimental reference peak condition in terms of d/λ maybe 2d/? Let's see if peaks at integer: d/λ = m? Then 2 n d = m λ? Wait if d/λ=m -> 2 n d? For n=1, condition 2d = m λ? If m=2, d/λ=1; m=4, d/λ=2; m=6, d/λ=3. So peaks at even orders? But first peak m=2? Why no peak at m=1 (d/λ=0.5)? Maybe thickness range? Maybe graph only shows from d/λ=0.5? It starts at 0 but peak at 0.5 perhaps not; maybe because of reflectivity or mirror? Hmm.
Maybe the transmission vs d/λ for Fabry-Perot with R maybe includes phase shift due to mirror: refletividade de espelhos semitransparentes can have phase shift upon reflection. For a symmetric Fabry-Perot, if reflection phase shift is 0 or π, resonance condition may be 2nd = (m + 1/2)λ? Let's explore.
The problem statement: "Um interferômetro de Fabry–Perot é constituído por dois espelhos paralelos semitransparentes, com refletividade constante R, separados por uma distância variável d, entre os quais a luz sofre múltiplas reflexões. A luz transmitida pelo sistema resulta da superposição de várias contribuições sucessivas. O comportamento do interferômetro em incidência normal foi analisado em dois experimentos (I) e (II). No experimento (I), considerado como referência, a cavidade está preenchida por ar e é iluminada por luz monocromática de comprimento de onda no vácuo λ. O gráfico mostra a transmissão em função de d/λ."
Maybe graph I has peaks at d/λ = 1,2,3. The problem probably expects students to know transmission curve shape? It may have maxima when 2d = mλ? If so peaks at d/λ=m/2, but graph I with peaks at 1,2,3 would correspond m even only? Why only even? Maybe because mirror reflectivity? Could be if transmission maxima occur at 2d = (2m+1)λ/2? Then d/λ=(2m+1)/4 → 0.25,0.75,1.25,... no.
Let's derive more carefully: Consider a Fabry-Perot etalon with two identical mirrors, reflection coefficient r, transmission coefficient t (complex). The transmitted field is sum: t^2 e^{iφ0} E0 [1 + r'^2 e^{iδ} + (r'^2 e^{iδ})^2 + ...]? Need phase. For a plane wave, after first transmission through first mirror, travels distance d to second mirror, transmits; or reflects at second, travels back, reflects at first, travels forward, etc. The phase difference between successive transmitted waves equals phase accumulated in one round trip plus reflection phase shifts at mirrors. If both mirrors are identical, reflection from either side? The reflection phase shifts may not cancel? In a symmetric cavity, the sum of reflection phase shifts for two reflections (one at each mirror) might be 2φ_r. The round-trip geometric phase = (4π n d)/λ. Total phase difference δ = (4π n d)/λ + 2φ_r (maybe). For lossless mirrors, φ_r = 0 or π? Actually reflection from a dielectric interface: external reflection (air to glass) phase shift π; internal reflection (glass to air) 0. But in Fabry-Perot, the reflections involved: after transmission through first mirror, light reflects at second mirror (inside medium to mirror) maybe; then reflects at first mirror (inside medium to mirror) etc. For symmetric mirrors, the reflection phase shifts for internal incidence may be same? If both mirrors are identical, the reflection from inside (cavity side) has same phase shift φ_r. So total δ = (4π n d)/λ + 2φ_r. Max when δ = 2π m => 2 n d/λ = m - φ_r/π? If φ_r=π/2? Hmm.
But graph I with peaks at d/λ integers could indicate resonance condition d = mλ/2? Actually d/λ=1 => d=λ => 2d=2λ, even m. If phase shift 2φ_r = π? Then δ = 2π m? Let's calculate: 2 n d/λ = m - φ_r/π. If m integer and peak at d/λ=1: 2 = m - φ_r/π => m = 2 + φ_r/π. If φ_r=0, m=2. If φ_r=π, m=3? Not helpful.
Maybe the graph I is not exactly the standard transmission but a specific curve: It shows peaks at d/λ = 1,2,3 and transmission shape. The question might be designed so that we compare shift. We can solve using general relation: Transmission maxima occur whenever 2nd cosθ = mλ (or maybe mλ/2?); with n=1 for experiment I. From graph I, we can infer whether m starts? But we can also use the ratio: In experiment II, optical path length 2nd = 2*(3/2)*d = 3d. Vacuum wavelength λ' = 3λ/4. Thus 2nd/λ' = 3d / (3λ/4) = 4d/λ. So phase condition for max: 4d/λ = m (if condition 2nd = mλ')? Let's see: Max when 2 n d = m λ'? Then 3d = m*(3λ/4) => 4d/λ = m, so d/λ = m/4. Yes same. So peaks at multiples of 0.25.
But note experiment I graph maybe peaks at d/λ = ? If condition in experiment I: 2d = m λ => 2d/λ = m => d/λ = m/2. Graph I would have peaks every 0.5. But if it shows every 1, maybe it's because only peaks with m even? Wait maybe graph I is not from d/λ=0 to3 with peaks every 0.5? Let's reconsider: The graph I might actually have six peaks? Let's inspect: The x-axis has tick marks at 0,1,2,3; maybe the first peak is at x=0.5, then 1,1.5,2,2.5,3? It would have peaks at every 0.5, total 6 peaks. The image maybe could be showing 6 thin peaks, but I misread? Let's zoom: In graph I, the curve has a peak at about 0.5? There is a vertical line at x=0.5? Let's count the number of peaks: From left, first peak maybe near 0.5; second near 1.0; third near 1.5; fourth near 2.0; fifth near 2.5; sixth near 3.0. But the axis labels 1 and2 are under maybe the second and fourth peaks? Let's see: The x-axis label "1" is under the first visible peak? Actually if the first peak is at 0.5, then the label "1" would be under the second peak. The second peak at 1.0; label "1" maybe slightly left of second peak? Hard.
Let's examine the overall shape: It might have more peaks. The graph in the problem: "Gráfico do experimento (I)" has thick vertical lines. I see at least four? Let's count: Starting from left: a peak near x=0.5? no, maybe no peak; then a peak at x=1, then x=2, x=3. The line at x=1 has label 1 below; line at x=2; line at x=3. I don't see line at 0.5 or 1.5. So likely peaks at integer. But then why physics? Maybe condition is 2nd = mλ with m integer? Wait if n=1 and d/λ integer = m, then 2d/λ=2m even integer, so m even. But graph only shows even orders. Why would odd orders absent? Maybe because of dispersion? No. Maybe because the x-axis is d/λ_air? no.
Let's search memory: This might be an ITA 2027 question? Could be from a known exam. Maybe answer is B? Need be careful.
Let's read exactly: "No experimento (I), considerado como referência, a cavidade está preenchida por ar e é iluminada por luz monocromática de comprimento de onda no vácuo λ. O gráfico mostra a transmissão em função de d/λ." So graph I is given; maybe the peaks at d/λ = 1,2,3? Actually if the air gap has reflectivity R, the transmission maximum occurs when 2 d = m λ? Wait maybe if there is a phase change of π on reflection at one mirror, resonance condition becomes 2d = (m+1/2)λ? Let's derive from standard Fabry-Perot with absorptionless mirrors: The transmitted intensity is T_max = 1/(1 + F sin^2(δ/2)) where δ = (4π n d/λ) + 2φ? Actually often δ = (4π n d/λ) cosθ + 2φ, where φ is phase shift on reflection. For dielectric mirrors, φ may be 0 or π? If both mirrors have same phase shift φ, then δ = (4π n d/λ) + 2φ. Max when δ = 2π m => 2nd/λ = m - φ/π. If φ=π/2? Not typical. For metal mirrors, reflection phase shift may be arbitrary. But problem says "refletividade constante R" maybe not phase shift. In many textbook derivations: Transmission maxima when 2nd cosθ = mλ. They ignore reflection phase shift or assume it cancels? Actually if both mirrors are identical and reflection occurs from air into mirror and from cavity into mirror, the phase shifts might be same? Let's derive using scattering matrix: For a symmetric lossless mirror, reflection coefficient from outside (air) and inside (substrate) may differ by π? But if both mirrors are identical, the two reflections in a round trip at second and first mirror: first reflection at second mirror (from inside medium to mirror?); second reflection at first mirror (from inside medium to mirror) so both same type? Yes both are internal? Wait after passing first mirror into cavity, light travels to second mirror, reflects at second mirror inside cavity; then returns to first mirror, reflects at first mirror inside cavity. Both reflections are from cavity side onto the mirror. They are of same type (if mirrors symmetric? Actually first mirror: light inside cavity incident on first mirror, reflects back into cavity; second mirror: light inside cavity incident on second mirror, reflects back. For identical mirrors, reflection phase shift may be same. Thus total reflection phase shift 2φ. So δ = (4πnd/λ)+2φ. Transmission max when δ=2πm => 2nd/λ = m - φ/π. So if graph I has peaks at d/λ=1,2,3, we can determine φ? For n=1, 2d/λ = 2m' maybe? If peaks at integer d/λ, then m - φ/π = 2*(integer). So φ/π could be 0? m even? Then m - φ/π = even => φ/π integer? If φ=0, m=2,4,6; so peaks at even orders; odd absent. But why odd absent? Maybe because the first mirror transmission? No, odd orders should also transmit if resonance condition includes m odd. Graph I would still show them with same height. Unless d/λ interval only 0-1? no. Maybe the graph x-axis label d/λ not d/λ? It might be d/(λ/2)? Let's see: For peaks at d/λ = 1,2,3, if formula 2d/λ = m, then m=2,4,6, so peaks correspond to even m. Maybe graph I starts at d=λ? Maybe no odd because d cannot be less than some value? But d variable maybe from 0? Hmm.
Maybe the transmission function for a Fabry-Perot in terms of d/λ: The free spectral range in d/λ is 1/2? Actually if you change d by λ/2, transmission goes through one maximum; so over d/λ range 3, there should be 6 maxima. But many problems maybe show graph with "picos" at d/λ = 1,2,3? Could be an idealized graph with only three peaks because they chose specific R and plotted? Wait if the graph has horizontal axis d/λ, the peaks are at d/λ = 1,2,3, maybe because λ is wavelength inside medium? If λ inside = λ/2, then d/λ_inside = 2d/λ = integer? That would give d/λ = m/2, still half-integer. No.
Let's inspect graphs of alternatives: A shows 4 peaks (maybe at d/λ = 1,2,3? No, A has 4 peaks distributed over 0-3). C shows many peaks with height ~0.75 (not 1.0). D shows 3 peaks at 1,2,3 with lower? Actually D has two peaks? Let's count D: There are peaks at x=1 and x=2? Only two? Actually D maybe 2 peaks? Let's zoom D: y-axis 0-1; peaks at x~0.8? Wait D: It has a peak at x=1? There are tall peaks at x=1 and x=2 maybe; not at 3? Let's count: D: peak at x=1, x=2, and maybe x=0? no, starts high? Actually D: transmission at x=0 maybe 0? It has broad peaks maybe two? Let's not.
Maybe we need determine peak height. For Fabry-Perot with reflectivity R, peak transmission is 1 (if no absorption). Experiment I peaks reach 1.0. Experiment II should also reach 1.0? If mirrors remain same and no absorption, yes maximum should be 1.0. Thus eliminate C (peaks 0.75). Also if light wavelength changes, R same, peak height remains 1. So C out. Good.
Now peak spacing: Experiment II with n=3/2, λ'=3λ/4. Let's compare the "optical thickness" in units of original λ: d/λ appears with factor? The resonance condition: 2 n d = m λ' (if standard). Then 2*(3/2)d = m*(3λ/4) => 3d = 3mλ/4 => d/λ = m/4. So peaks should be four times denser than if it were air with same λ? In experiment I if standard condition 2d = mλ, peaks at d/λ = m/2. Experiment II peaks at d/λ = m/4, so twice as dense as experiment I! If experiment I graph had peaks at integer? No, if standard peaks at m/2, graph I should have 6 peaks; but if it shows 3 peaks at integers, maybe it corresponds to condition 2d = mλ with m even? Wait if graph I peaks at integers, spacing 1. Experiment II spacing maybe 0.5 if doubled? Need decide.
Let's derive from the presence of reflection phase shift maybe. Suppose in experiment I, peaks at d/λ = m (integers), i.e. 2d/λ = 2m. This could be because φ/π = 0? Then m = ? Let m' = m_phase? Actually δ = 4πd/λ + 2φ = 2π m => 2d/λ = m - φ/π. If peaks at integer d/λ, then m - φ/π = 2*(integer). If φ=0, m even; if φ=π, m odd? Let's test: φ=π, δ=4πd/λ+2π, max when 4πd/λ+2π=2πm => 2d/λ = m-1, so peaks at d/λ = (m-1)/2 = 0,0.5,1,... still half-integers, not integers. If φ=π/2, 2d/λ = m - 1/2, not integer either. So no simple.
Maybe the condition is not 2nd = mλ but 2nd = (m+1/2)λ? For φ? If max when δ=2πm, with δ=4πnd/λ + 2φ. If φ=π/2? 2nd/λ = m - 1/2, half-integers. Not integer.
Let's examine graph I at d/λ=3 maybe peak; interval 0-3 exactly 3 peaks. If the transmission function peak spacing were 1, then "free spectral range" in d/λ is 1, which implies Δ(2d/λ) = 2? Or the order m increments by 2 per peak. Maybe because the experiment was performed with a monochromatic source whose wavelength is λ, and graph x-axis d/λ. They maybe normalized by λ but the actual d values produce maxima at d = m λ? Let's see: If d = m λ, then 2d/λ = 2m even; peaks could be even orders. Why odd orders absent? Maybe because the mirror reflectivity and phase shift cause only even resonances? But physically, both odd and even orders should exist if cavity length changes continuously; unless there is a central defect? Let's not overfit.
Maybe the graph I is not of raw transmission; it has "transmissão" in function of d/λ, but maybe the peaks are at d/λ = 1,2,3 because the source spectrum has only those resonances? No, monochromatic, continuous d.
Let's read alternative D: It shows 3 peaks, same as experiment I but maybe wider? D's peaks at d/λ=1,2,3; maybe if answer D, then experiment II with n=1.5 and λ'=0.75λ causes peaks at same d/λ positions? Let's verify: condition 2 n d = m λ' => 2*(3/2)d = m*(3λ/4) => 3d = 3mλ/4 => d/λ = m/4, not same. So no.
Wait maybe the condition for transmission maximum in terms of d/λ' (the light wavelength in vacuum in experiment II) would be 2nd = mλ' => 3d = m*(3λ/4) => d/λ' = m/3? But x-axis is d/λ (original). If the graph x-axis were d/λ' instead, then peaks at d/λ' = m/(2n)=m/3, spacing 1/3. In 0-3, 9 peaks. Alternative B perhaps 9 peaks? Let's count B: It might have 9 peaks? It shows many peaks, maybe 8? Let's count carefully from image B: There are 8 peaks? Actually B: x-axis 0 to3, peaks at approximately: 0.25? Let's count: one at 0.3, 0.6? Hmm.
Let's identify peaks in alternatives by counting number of vertical lines:
- A: 4 peaks? Actually A has 4 peaks? Let's count: peaks at ~0.75, 1.5, 2.25, 3.0? That's 4 peaks; spacing 0.75. Could correspond to d/λ = m/??? m/ (4/3)? no.
- B: maybe 8 peaks? Let's count: There are 8 peaks in 0 to3; spacing 0.375? Maybe.
- C: maybe 12 peaks? It has many low peaks, maybe 12; but height lower (0.75).
- D: 3 peaks (maybe broad) at 1,2,3; or 2? Let's count D: There are peaks at x=0.75? No, D maybe peaks at 1,2? Actually D has tall peak at 1, tall peak at 2, and maybe tail; only 2? Let's see: D x-axis labels 0,1,2,3; first peak at 1, second at 2; no peak at 3? There is a small tail maybe no. Could be 2.
- E: many peaks, maybe 9? Let's count E: it has 9 peaks? E x-axis 0 to3; there are 9 vertical lines? Let's estimate: E has a peak at 0? starts high? Actually E: first peak near 0? It has maybe 12 peaks? Hmm.
Let's solve using physics and compare with graph I if we can infer condition robustly.
The problem statement says: "No experimento (II), os espelhos permanecem os mesmos, mas a cavidade é totalmente preenchida por um líquido de índice de refração n = 3/2, e a luz incidente passa a ter comprimento de onda no vácuo λ' = 3/4 λ. Despreze a absorção e a dispersão e assuma que a refletividade dos espelhos não se altera. Assinale a alternativa que melhor representa a nova curva de transmissão do experimento (II) no mesmo intervalo do eixo horizontal."
They explicitly give n and λ' in terms of λ. They might expect using formula: A distância entre máximos consecutivos no eixo d/λ? We can derive ratio of maxima spacing between experiment II and I:
For general medium index n and vacuum wavelength λ_vac, transmission maxima occur when 2 n d = m λ_vac? So d/λ_vac = m/(2n). The spacing in d/λ_vac between consecutive maxima is Δ(d/λ) = 1/(2n). Experiment I: n=1, λ_vac=λ; spacing Δ1 = 1/2. Experiment II: n=3/2, λ_vac=λ'=3λ/4, but if horizontal axis is d/λ (original λ), then d/λ_vac? Let's compute: resonance d = m λ'/(2n) = m*(3λ/4)/(3) = m λ/4? Wait 2n=3, so d = m*(3λ/4)/3 = m λ/4. Thus d/λ = m/4. Spacing Δ2 = 1/4. So peaks are twice as dense as experiment I (spacing 1/4 vs 1/2). Since graph I maybe spacing 1? If graph I peaks spacing 1, then experiment II spacing 1/2? That would be 6 peaks in 0-3. Which alternative has 6 peaks? Let's count E maybe? E maybe 6? Let's see: E: peaks maybe at 0.25? no. Let's count alternatives:
- A: 4 peaks -> spacing ~0.75 not 0.5? Maybe if graph I spacing 1, then A? No.
- B: maybe 8 peaks? spacing 0.375.
- C: many ~12.
- D: 3 peaks.
- E: many maybe 12? Actually E looks like 12 peaks? Let's count E: It has 12? Hmm.
Wait if experiment I spacing 1, and experiment II spacing 0.5, graph would have 6 peaks in 0-3, but no alternative obviously 6? Let's count A maybe 4; B maybe 8; C maybe 12; D 3; E maybe 8? Let's re-examine B and E: B has 8 peaks? E has 6? Let's identify: B x-axis labels 0,1,2,3; there are 8 peaks? Count: from 0 to1 there are 3 peaks? Actually B: maybe peaks at every 0.4? Let's count number of intervals between peaks: It shows 8 peaks (maybe at 0.2,0.6,1.0,...)? no.
Let's zoom into B: I can see vertical lines: one at ~0.25, 0.75, 1.25, 1.75, 2.25, 2.75, 3.0? maybe 6? Let's count: B has 6? It actually seems to have 7? Hmm.
Maybe the correct graph should have 6 peaks? Let's determine peak spacing from experiment I. If graph I has peaks at d/λ = 0.5,1,1.5,2,2.5,3 (6 peaks), then experiment II with Δ=1/4 would have 12 peaks; maybe E or C? C height lower, so not. E has many peaks (maybe 12) and high. That seems plausible: E has many peaks (12) in 0-3, height 1. Maybe answer E? But need check.
But if graph I has peaks at d/λ = 1,2,3 (spacing 1), then experiment II with d/λ spacing? Let's compute ratio differently: The ratio of spacing Δ2/Δ1:
For experiment I, if graph shows spacing 1, maybe formula should be 2nd = 2mλ? Then Δ1 =1; for experiment II, maybe condition 2 n d = m λ'? Then d = m λ'/(2n)=m*(3λ/4)/3 = mλ/4 -> Δ(d/λ)=1/4, so much denser. But if graph I spacing 1, then experiment II spacing 0.25 would be 12 peaks; alternative maybe E 12? Hmm.
Let's parse the wording: "O gráfico mostra a transmissão em função de d/λ." Not "d/λ_0"? Then experiment II "no mesmo intervalo do eixo horizontal." If they wanted d/λ' they would say. So horizontal axis same d/λ, original λ. Then we can compute peak positions relative to original λ. Let's derive with phase shift possibility.
Let's attempt to solve from first principles using the provided graph I to calibrate. The Fabry-Perot transmission (Airy function):
T = 1 / [1 + (4R/(1-R)^2) sin^2(δ/2)]
where δ = (4π n d / λ) cosθ + 2φ? At normal incidence cosθ=1. Max when sin=0 -> δ/2 = mπ -> δ = 2πm. So 4π n d / λ + 2φ = 2π m => 2 n d / λ = m - φ/π. Let's define order m and phase factor. For experiment I, n=1, λ original, graph peaks at some d/λ. Suppose the graph has peaks at d/λ = 1,2,3. Then for each peak:
2*(d/λ) = m - φ/π = integer - φ/π. Since d/λ integer, LHS is even integer. Thus φ/π must be an integer? Because RHS = integer - φ/π must be even integer. If φ/π = 0, then m even; if φ/π = 1, then m odd? But φ/π=1 -> RHS=m-1 even => m odd; possible. So φ could be 0 or π. The graph I with 3 peaks at integers could be either even orders or odd orders, but not both. Why no adjacent peaks? Because maybe the free spectral range is 0.5 and graph only shows every other peak? But if the transmission function has maxima at d/λ = 0.5,1,1.5,... and all equal height, how could graph show only integer ones? Unless the source linewidth or instrument? No.
Maybe in experiment I, the cavity "preenchida por ar" but the mirrors are semitransparent with reflectivity R; perhaps the transmission curve is like a "frequency comb" with peaks at multiples of λ/2. The graph might be from a specific range d = 0 to 3λ, and the peaks at d/λ = 1,2,3 are indeed the only maxima because at d/λ=0.5 etc maybe R too low? No.
Let's consider: The x-axis in graph I might not be d/λ but d/(λ/2)? Actually label says "d/λ"; but if d/λ=1, the optical path difference 2d = 2λ; if d/λ=0.5, optical path difference = λ. Constructive interference should occur at d=mλ/2. So yes there should be peak at 0.5. Unless the reflection phase shift causes destructive at d=0.5, but constructive at integer? Let's derive with φ=π/2? δ = (4πd/λ)+π = 2πm => 4d/λ = 2m -1 => d/λ = (2m-1)/4 = 0.25,0.75,... not integer. So no.
Maybe graph I is not of air but of a "Fabry-Perot" where d is varied but "d/λ" labels the order m? Wait maybe x-axis is "d/λ" but the display has "1" corresponds to the first peak at d=λ (m=2); the next at d=2λ (m=4), because the graph's horizontal axis only covers 0 to3 but the first peak at 1? There is no peak at 0? Starting at d=0 maybe transmission 1? No, graph at x=0 starts low, not peak. But theoretically at d=0, δ=0 -> sin(0)=0 -> T=1? Wait sin(δ/2)=sin0=0, T=1. But graph at d/λ=0 shows transmission low (~0)? Actually it starts near 0? Let's look: At x=0, curve may start near 0? It might be at 0? In graph I, the leftmost point maybe T=1? Actually there is a vertical line at x=0? No, horizontal axis starts at 0, curve maybe near 0? Let's see: The y-axis "Transmissão" 0,0.5,1.0. At x=0, curve starts at 0? The first peak maybe at x=0? The graph might actually have a peak at x=0? It starts at 0 with high? Hmm image: The first vertical line could be at x=0? There is no gap; but label 0 at left; there is a vertical line at x=0? The graph begins with a peak maybe? Let's inspect: The text "0" at left under axis; a vertical line at x=0 maybe T=1? It might have a peak at x=0 (line on y-axis), then low, then peak at x=1? If so, peaks at 0,1,2,3? That would be 4 peaks, spacing 1. But condition maybe d/λ = integer? Hmm.
Let's look at the graph I: It has a line at x=0? Actually the leftmost visible full peak might be at x=0.5? Wait the first vertical line appears not at 0 but slightly right of 0, maybe 0.5. The x-axis label 1 is under the second vertical line? Let's count: There are vertical lines: first near 0.5, second near 1.0, third near 1.5, fourth near 2.0, fifth near2.5, sixth near3.0? If so, the labels 1,2,3 maybe under the second, fourth, sixth peaks. The graph may indeed have 6 peaks! Let's zoom enough: The shape: It has peaks at approximately intervals of 0.5. The x-axis has tick labels 0,1,2,3, but each major interval 1 contains two peaks. Let's see: Between x=0 and x=1, there should be two peaks (0.5 and1.0). The first peak at ~0.5 (not labeled), second at 1.0 (labeled 1). Then between 1 and2, peaks at 1.5 and2.0; between 2 and3, peaks at2.5 and3.0. That would be 6 peaks. The image maybe I misread: It has more peaks than 3; I originally saw 3 because the first and third? Let's count in graph I: Leftmost: a peak around 0.5, then maybe low, then peak around 1.0, then low, then peak around 1.5, then low, then peak around 2.0, then low, then peak around2.5, then low, then peak around3.0. It's possible. The graph title "Gráfico do experimento (I)" maybe standard Fabry-Perot with R high; the peaks are evenly spaced. The visual maybe has 6 peaks; labels 1,2,3 might be positioned at every other peak? Let's inspect the x-axis: The label "1" is roughly under the second peak? If there are 6 peaks, the label "1" under the second peak, "2" under the fourth, "3" under sixth. Yes plausible. The graph's first peak near 0.5 may not have label. So standard condition n=1, λ: peaks at d/λ = m/2 (m=1,2,...): 0.5,1,1.5,2,2.5,3. That matches. Good. So experiment I reference has spacing Δ1 = 1/2 in d/λ. Great.
Thus experiment II expected peak spacing? Need be careful with wavelength: Experiment II uses λ' = 3λ/4, n=3/2. If horizontal axis is same d/λ (original λ), then resonance condition:
For a given order m (integer), peak position d_m = m λ'/(2n) = m*(3λ/4)/(3) = m λ/4. So d_m/λ = m/4. Thus peaks at m/4: m=0,1,2,... In interval 0 to3, m=0..12 -> 13 peaks, including at 0? Actually m=0 -> d=0, peak at x=0? In experiment I, m=0 peak at 0 should also exist; graph maybe includes x=0? It might be off or at 0. At x=0, transmission maybe max? But graph might not show. Anyway.
But wait if order m integer in formula 2nd = mλ'? Let's verify: For m=0, d=0, trivial; m=1, d=λ/4; etc. Total peaks in (0,3] = 12 peaks (m=1..12) plus at 0 maybe. Which alternative has 12 peaks? Let's count alternatives:
- E: maybe 12 peaks? It has many; likely 12. Let's count E: x-axis 0-3; I can count peaks at ~0.25? Not sure; but E looks similar to Fabry-Perot with peaks at every 0.25? If it has 12 peaks in 3 units, spacing 0.25. E is a candidate.
- C: also many peaks but with lower transmission (0.75), so not (unless reflectivity changed? no).
- B: maybe 8 peaks? Let's count B: It has peaks at maybe ~0.375? 0.75? Hmm not 0.25.
- A: 4 peaks (spacing 0.75? maybe if condition different)
- D: 3 peaks.
Let's count E precisely: The graph E has maybe 12 peaks? Count peaks from left: at x~0.25? no, first peak maybe at 0.25? Actually I see 12 vertical lines? Let's use y-axis: It is tall. E: horizontal axis labels: 0,1,2,3. Between 0 and1, there are 4 peaks? If spacing 0.25, there should be peaks at 0.25,0.5,0.75,1.0 -> 4 peaks in first interval (including 1). Between 1 and2: 4 peaks; between2 and3:4; total 12. The image E maybe has 12 peaks? It looks like many, maybe 12. Could be E.
But let's not rush; there may be another effect: Experiment II light wavelength λ' = 3λ/4; its frequency is higher, but the transmission peaks condition in terms of d/λ (original λ) as above. So answer likely E if peak spacing 0.25 and height 1. But let's re-read problem: "No experimento (II), os espelhos permanecem os mesmos, mas a cavidade é totalmente preenchida por um líquido de índice de refração n = 3/2, e a luz incidente passa a ter comprimento de onda no vácuo λ' = 3/4 λ. Despreze a absorção e a dispersão e assuma que a refletividade dos espelhos não se altera." They might expect using the fact that optical path length in cavity is n*d and wavelength in vacuum is λ'. The condition for transmission maxima: 2 n d = m λ'. So d/λ' = m/(2n) = m/3. But the graph horizontal axis is d/λ, so d/λ = d/(λ' * (4/3)) = (3/4)*(d/λ') = (3/4)*(m/3) = m/4. Yes.
But maybe the graph's horizontal axis is "d/λ'" because it says "nova curva no mesmo intervalo do eixo horizontal" and the horizontal variable might be d/λ (the incident wavelength in vacuum in each experiment) but not explicitly labeled in alternatives? Actually the labels "d/λ" on alternatives; in experiment II, λ is original? The problem says "no mesmo intervalo do eixo horizontal" not "mesmo eixo"; but alternatives likely have same label "d/λ" as original. So okay.
Let's evaluate peak height and width: For Fabry-Perot, if reflectivity R same, the peak width? The finesse depends on R, not n or λ? The width in d/λ scales? The full width at half maximum (FWHM) in phase δ is constant determined by R. In terms of d/λ, FWHM = (FWHM_δ)/(4π n)?? Let's derive: δ = 4π n d/λ. At half maximum, δ change Δδ = 4π n Δd/λ = constant (for given R). So Δd/λ = constant/(4π n). Since n increases, width in d/λ decreases? Actually if n=1.5, width is smaller than for n=1 by factor 2/3. But in graphs, relative width? The peak height same; narrower? Alternative E maybe peaks narrower; okay.
But there is another possible issue: The liquid has index n=3/2, and incident light from air into the cavity. At the first mirror, there is reflection; the cavity medium index maybe not 1. Does the reflectivity R of the mirrors remain same? They assume yes. The mirror is between air and liquid; the reflection coefficient at mirror might depend on index contrast? But problem says assume reflectivity does not alter.
Now, let's consider if experiment II uses λ'=3λ/4 but the graph horizontal axis maybe also scaled by original λ. We have peaks at m/4. Which alternative matches E? Need count E maybe 12 peaks; but if there are 13 peaks including 0? The graph x-axis from 0 to3, m=0 at0 (peak at y-axis maybe not counted), m=12 at3. So 12 peaks if starting at 0 not visible? Actually if m=0 is at 0, and if the graph begins just after 0, maybe first peak at 0.25; total m=1..12 exactly 12 peaks. E likely has 12 peaks. Let's verify B may have 8 peaks; E has maybe 12. Let's count E more confidently: I can count: at x=0.25, 0.5, 0.75, 1.0, 1.25, 1.5, 1.75, 2.0, 2.25, 2.5, 2.75, 3.0 -> 12 peaks. The image E: I see many vertical lines; yes maybe 12. The spacing visually quarter of interval. So answer E.
But let's not ignore alternative A: It shows 4 peaks in 0-3. Could correspond to n=3/2 and λ'=3λ/4 but using condition maybe d/λ = m? Let's see if someone incorrectly uses 2 n d = m λ (not λ'?) Then 3d = mλ => d/λ = m/3 -> peaks every 0.333: 0.333,0.667,1,... total 9 peaks; none. If incorrectly uses 2n d = mλ'? Already 1/4. Alternative A spacing 0.75 = 3/4; could correspond to condition d/λ = m/ (4/3)? no.
Let's derive more systematically with potential reflection phase shift and compare with graph I. Suppose in experiment I, peaks at d/λ = 0.5,1,1.5,2,2.5,3. This implies transmission maxima occur when 2d/λ = integer (m). That is δ = 4πd/λ (maybe plus 0) = 2π*(2d/λ), so order m integer. Good.
In experiment II, if the cavity is filled with liquid n=3/2, the phase difference for round trip: δ = (4π n d)/λ' (if no additional phase shift). Max when δ = 2πm => 4π n d/λ' = 2πm => 2 n d = mλ' => 2*(3/2)d = m*(3λ/4) => 3d = 3mλ/4 => d = mλ/4. So d/λ = m/4. If reflection phase shift changes with liquid? It might, but problem says assume reflectivity not change; phase shift? Maybe not considered. So peaks at m/4.
But wait, what if the transmission maxima condition includes the refractive index on both sides of the mirrors? The cavity medium is liquid, but the light outside is air. The mirrors are "semitransparentes" so light enters from air through first mirror; the phase accumulated in the cavity is (2π/λ_medium)*2d = (2π/(λ'/n))*2d = 4π n d/λ'. yes.
Therefore, the pattern is simply compressed along d/λ by factor (1/2n?) Let's compare to experiment I: Experiment I Δ(d/λ)=1/2. Experiment II Δ=1/(2n) *? Relationship: Experiment I with n=1, λ'=λ: Δ1=1/2. Experiment II: resonance d = m λ'/(2n) = m*(3λ/4)/(3)=mλ/4 => Δ2=1/4 = Δ1 * (λ'/λ) * (1/n)? = (1/2)*(3/4)/(3/2)= (1/2)*(3/4)*(2/3)=1/4 yes. So density doubles. So from graph I with 6 peaks in 0-3, experiment II should have 12 peaks. E is the only high-transmission graph with 12 peaks? Let's confirm B maybe 8, C low, D 3, A 4. Thus E.
But let's see if maybe graph I has peaks at d/λ=1,2,3, and then experiment II with Δ=1/4 gives 12 peaks; still E maybe. If graph I had 3 peaks, then graph with 12 peaks seems too many? The problem asks "melhor representa"; E with many peaks likely.
Let's inspect E's peak positions relative to graph I if both overlaid: Experiment I spacing 0.5, so peaks at 0.5,1,1.5,2,2.5,3. Experiment II spacing 0.25, so peaks at 0,0.25,0.5,0.75,1,1.25,... It includes all experiment I peaks plus additional at quarter positions. If we look at E, it has peaks at experiment I positions (0.5,1,...) plus intermediate. The graph I and E maybe both have high peaks. Is E consistent with "melhor representa"? Maybe E has exactly twice as many peaks. The graph E might have a peak at x=0? It might include; we can't see.
Let's consider another possibility: There is a change in optical path due to liquid and wavelength such that the number of peaks in same interval remains same? Let's check if someone uses formula 2nd = mλ' but forgets λ' given as λ'=3λ/4 and n=3/2: then 2*(3/2)d = m*(3/4)λ => 3d = 0.75mλ => d/λ = 0.25m. Yes. So definitely 12 peaks.
But maybe the question asks "no mesmo intervalo do eixo horizontal" and the alternative graphs are labeled with x-axis maybe d/λ'? If x-axis is d/λ' (new wavelength), then spacing = 1/(2n) = 1/3, total 9 peaks in 0-3 (m=0..9? m=0 at0, m=9 at3? Actually d/λ'=m/3; in [0,3] m=0..9 -> 10 peaks). None exactly? B maybe 9? Let's count B: If spacing 1/3, peaks at 0,0.333,0.667,1,...3. In 0-3, 10 peaks? But m=0 at0, m=9 at3; 10 peaks. B maybe has 9 peaks? Not sure. But because labels on alternatives are d/λ, not d/λ', so use original.
Let's also consider the amplitude/transmission maximum: For a Fabry-Perot with identical mirrors, maximum transmission is 1 (if no absorption). All alternatives with peaks at 1.0: A, B, D, E. C peaks ~0.75, out. D has 3 peaks at 1,2,3 and maybe lower? Actually D also high? D peaks at x=1 and2 maybe T=1; not sure. But spacing? D peaks spacing 1; if experiment I spacing 0.5, then D maybe not. A spacing ~0.75; B spacing ~? Let's determine B peak count: B has 8 peaks maybe; spacing 0.375 (3/8?) If experiment II expected 12 peaks, B maybe 8 no. E 12 yes. Thus E.
Let's craft final explanation in Portuguese:
- Para o interferômetro de Fabry-Perot, em incidência normal, os máximos de transmissão ocorrem quando a diferença de fase entre raios sucessivos é múltiplo de 2π: δ = 4π n d / λ_vac = 2π m => 2 n d = m λ_vac.
- No experimento I: n=1, λ_vac = λ, então 2d = m λ => d/λ = m/2. Isso corresponde ao gráfico de referência, com picos em múltiplos de 0,5 (ou pelo menos a periodicidade de 1/2).
- No experimento II: n=3/2 e λ_vac = λ' = 3λ/4. Substituindo: 2*(3/2)d = m*(3λ/4) => 3d = 3mλ/4 => d/λ = m/4. Portanto os máximos ficam quatro vezes mais densos em relação a d/λ? Wait relative to d/λ spacing: experiment I spacing 1/2, experiment II spacing 1/4, so twice denser. "quatro vezes mais densos"? Let's compute: Δ1=1/2, Δ2=1/4, so Δ2 = Δ1/2, twice as dense. Not four. The m/4 vs? But okay.
- A curva deve ter picos altos (transmissão máxima 1) e o dobro de picos no mesmo intervalo em relação à referência? Since graph I has peaks spacing 0.5, experiment II spacing 0.25; in interval length 3, graph I has 6 picos (se considerarmos de 0,5 a 3), experiment II teria 12 picos. A alternativa E é a que possui 12 picos no intervalo, todos com altura 1. Letra E.
Need be cautious: If graph I reference has 6 peaks? In final explanation maybe "o gráfico I tem picos a cada 1/2 em d/λ"; then "no experimento II os picos devem aparecer a cada 1/4". I can mention "por isso a alternativa que mostra o dobro de picos, mantendo a altura máxima 1, é a E."
But if the user expects only answer line, we need include explanation and final line. The final line format "Resposta: X". We'll provide in Portuguese.
However, let's ensure no hidden trick: "Quando e se necessário, use as seguintes informações: ... relação entre índice de refração n de um meio e as constantes de permeabilidade μ_r e permissividade ε_r relativas é dada por: n² = μ_r ε_r." This additional info maybe irrelevant? Maybe to tempt? The question about Fabry-Perot optical. Not needed.
Let's also consider if the liquid has n=3/2 and light wavelength in vacuum λ'=3λ/4; maybe the condition for constructive interference in terms of "d/λ" might be affected by the wavelength in the medium: λ_medium = λ'/n = (3λ/4)/(3/2)= (3λ/4)*(2/3)=λ/2. Wait! Interesting: inside the liquid, the light wavelength is λ_medium = λ'/n = (3λ/4)/(3/2)= (3λ/4)*(2/3)=λ/2. So inside the cavity, the wavelength is λ/2, half the original vacuum wavelength. The optical path difference for a round trip is 2d; inside medium, phase = 2π * (2d)/λ_medium = 2π * 2d / (λ/2) = 2π * 4d/λ. Same as 4π n d/λ' = 4π*(3/2)d/(3λ/4)=? 4π*(3/2)*(4/(3λ))d = 4π * 2d/λ = 8π d/λ? Wait let's recalc: 4π n d / λ' = 4π*(3/2)d / (3λ/4) = 4π*(3/2)*(4/(3λ))d = 4π*(2/λ)d = 8π d/λ? That contradicts earlier 4π n d/λ' = 4π*(3/2)*(4/(3λ))d = 4π*(2/λ)d = 8π d/λ. Max when 8π d/λ = 2πm => 4d/λ = m => d/λ = m/4. Yes same. Good.
But note the phase difference is 8π d/λ, not 4π. So the peaks at d/λ = m/4.
Let's also consider if the graph I's horizontal axis could be d/λ with λ original but in experiment I, n=1, λ_medium=λ. Phase δ = 4π d/λ. Max when 4π d/λ = 2π m => d/λ = m/2. Good.
Now, if graph I shows peaks at d/λ=1,2,3 maybe not all? If m must be even? But with formula m all integers, graph I would have peaks at 1,2,3 (m=2,4,6) and also 0.5,1.5,2.5 (m=1,3,5). If the graph image actually shows only m even, maybe due to "refletividade constante R" and some phase? But then experiment II maybe? Let's see if our answer E remains? Let's test if graph I shows only every other peak (at .5? no, if m even, peaks at 1,2,3 not 0.5). Hmm. Let's not overcomplicate; ITA likely uses standard formula and graph I maybe visually includes all peaks; I think it includes 6. The question likely intended E because of number of peaks.
Let's confirm alternative E's peak count: Look at E: It has a peak at x=0? The leftmost vertical line maybe at x=0? If including, then 13 peaks in [0,3]. But if graph I included peak at x=0? Let's check graph I: At x=0 maybe T=1? The line maybe on y-axis. If graph I includes x=0, m=0; then it has 7 peaks (0,0.5,1,1.5,2,2.5,3). Maybe graph I visually doesn't show at x=0; low? The formula gives T=1 at d=0, but graph may omit? Anyway.
Let's craft final answer with explanation.
But final response should not be too long; desired oververbosity 5. We can include equations.
Let's write in Portuguese:
"Para um interferômetro de Fabry-Perot em incidência normal, os máximos de transmissão obedecem a 2 n d = m λ_vac. No experimento I, n=1 e λ_vac=λ, então d/λ = m/2; os picos são espaçados de 1/2 no eixo d/λ. No experimento II, n=3/2 e λ_vac=λ'=3λ/4, logo:
2*(3/2)d = m*(3λ/4) => 3d = 3mλ/4 => d/λ = m/4.
Assim, o espaçamento entre picos cai para 1/4, ou seja, o número de picos no intervalo 0-3 dobra em relação ao experimento I. A transmissão máxima continua 1, pois R não muda e não há absorção. A curva que mostra picos mais densos (12 picos no intervalo, em vez de 6) e com altura 1 é a da alternativa E."
Then final line "Resposta: E". Need ensure "12 picos" maybe if interval includes endpoints? Say "cerca de 12 picos" maybe okay. But if avoiding exact count, "mais densos" enough.
Let's finalize.