Correção UNICAMP 2027Confira as respostas e a resolução de cada questão da 1ª faseVer a correção
IA ao vivo / ITA 2027 · 1ª fase

COMPARE OS RACIOCÍNIOS

Questão 15

Gabarito oficial: E. ← 14 16 →

A questão

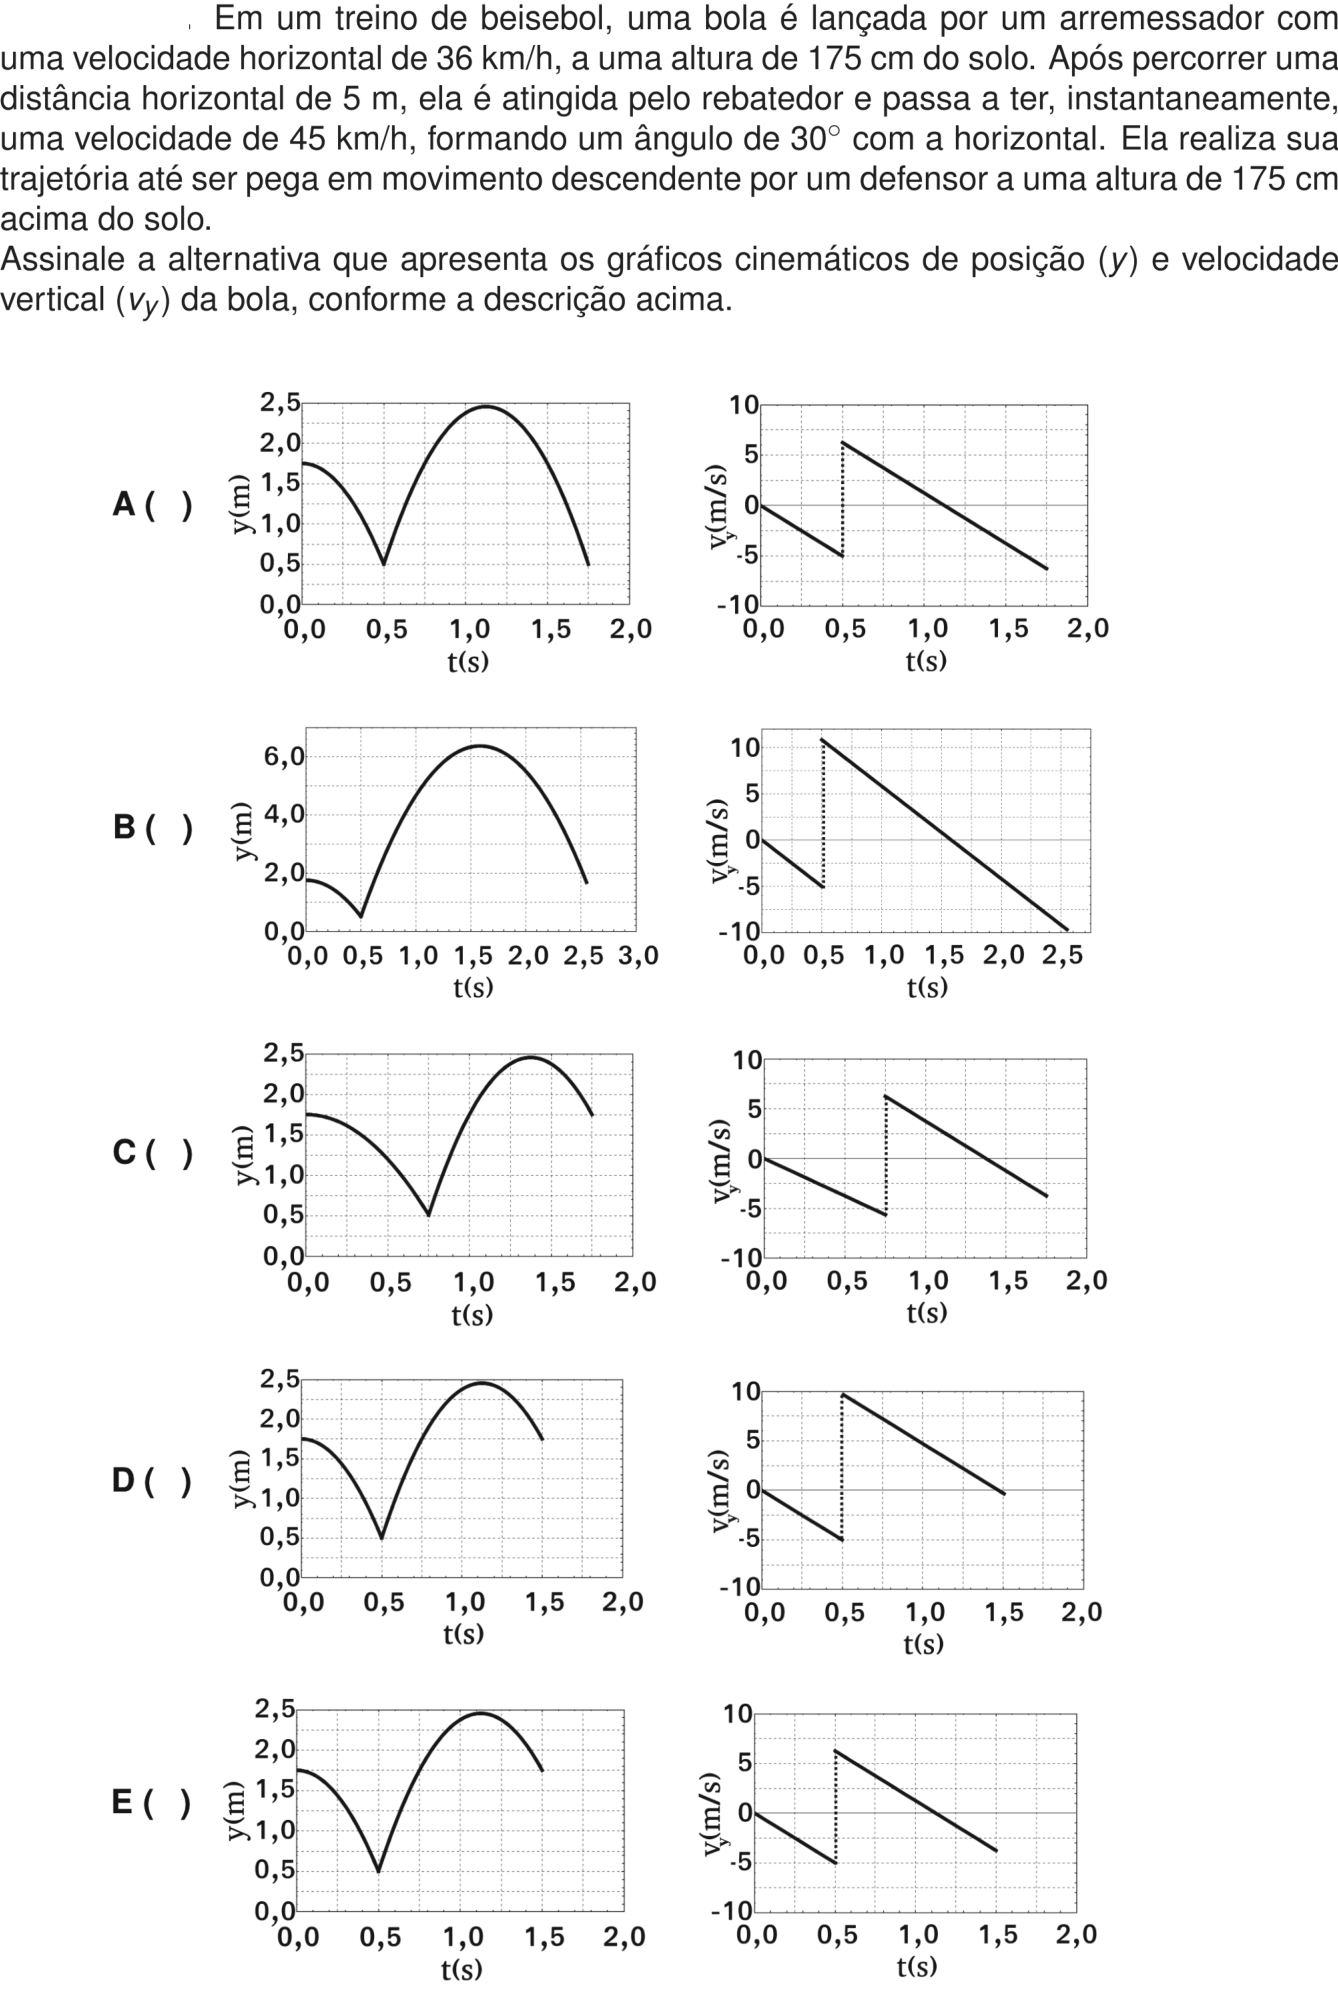
Texto de apoio da questão 15 Questão 15

Respostas das IAs

GPT-6 Astra

E

Respondeu

levou 18 s

Como pensou
**Calculating Portuguese Explanation** I need to solve a problem in Portuguese related to some calculations. I should calculate various components involving time and velocity, including determining maxima and roots of an equation. The goal is to explain these steps clearly and include formulas, although I don't need 500 words; around 300 will work. I'll also ensure to verify that the graph's maximum is correct. Overall, I want to provide a concise explanation in four paragraphs. Resposta E will conclude my work.

Adotando o sentido vertical para cima como positivo, a bola tem aceleração a_y=-10\,\text{m/s}^2 durante os voos.

1. Antes da rebatida

A velocidade horizontal é 36\,\text{km/h}=10\,\text{m/s}. Assim, a bola percorre os 5\,\text{m} em

t_1=\frac{5}{10}=0{,}5\,\text{s}.

Como a velocidade vertical inicial é nula, nesse instante:

y_1=1{,}75-\frac{10(0{,}5)^2}{2}=0{,}50\,\text{m}, \qquad v_{y1}=-10(0{,}5)=-5\,\text{m/s}.

2. Após a rebatida

A nova velocidade tem módulo 45\,\text{km/h}=12{,}5\,\text{m/s}, cuja componente vertical é

v_{y2}=12{,}5\sen30^\circ=6{,}25\,\text{m/s}.

Logo, em t=0{,}5\,\text{s}, o gráfico de v_y salta de -5 para 6{,}25\,\text{m/s}, voltando depois a decrescer linearmente com inclinação -10\,\text{m/s}^2.

A altura máxima é

y_{\max}=0{,}50+\frac{6{,}25^2}{2\cdot10} \approx2{,}45\,\text{m}.

3. Instante em que a bola é pega

Chamando de \tau o tempo após a rebatida:

1{,}75=0{,}50+6{,}25\tau-5\tau^2.

As soluções são \tau=0{,}25\,\text{s} e \tau=1{,}00\,\text{s}. Como a bola é pega na descida, vale a segunda solução. Portanto:

t_f=0{,}5+1{,}0=1{,}5\,\text{s}, \qquad v_{yf}=6{,}25-10(1)=-3{,}75\,\text{m/s}.

Os gráficos que apresentam todos esses valores são os da alternativa E.

Resposta: E

GPT-6.1 Sol

E

Respondeu

levou 13 s

Como pensou

Adotando o sentido vertical para cima como positivo, a aceleração da bola é a_y=-10\ \text{m/s}^2.

1. Antes da rebatida

A velocidade horizontal inicial é 36\ \text{km/h}=10\ \text{m/s}. Assim, a bola percorre os 5\ \text{m} em

t_r=\frac{5}{10}=0{,}5\ \text{s}.

Como a velocidade vertical inicial é nula,

y(t)=1{,}75-5t^2,\qquad v_y(t)=-10t.

No instante da rebatida:

y(0{,}5)=0{,}50\ \text{m},\qquad v_y(0{,}5^-)=-5\ \text{m/s}.

2. Depois da rebatida

A nova velocidade tem módulo 45\ \text{km/h}=12{,}5\ \text{m/s}, cuja componente vertical é

v_y(0{,}5^+)=12{,}5\sin30^\circ=6{,}25\ \text{m/s}.

Portanto, a posição permanece contínua, mas a velocidade vertical salta de -5 para +6{,}25\ \text{m/s}.

Chamando de \tau=t-0{,}5 o tempo após a rebatida:

y=0{,}50+6{,}25\tau-5\tau^2,\qquad v_y=6{,}25-10\tau.

A altura máxima ocorre em \tau=0{,}625\ \text{s}, isto é, em t=1{,}125\ \text{s}, e vale aproximadamente 2{,}45\ \text{m}.

Para encontrar o instante em que a bola é pega:

1{,}75=0{,}50+6{,}25\tau-5\tau^2.

As soluções são \tau=0{,}25\ \text{s}, na subida, e \tau=1{,}0\ \text{s}, na descida. Logo, a trajetória termina em

t=1{,}5\ \text{s},\qquad y=1{,}75\ \text{m},\qquad v_y=-3{,}75\ \text{m/s}.

Os gráficos que apresentam esses valores são os da alternativa E.

Resposta: E

GPT-6 Luna

A

Respondeu

levou 16 s

Como pensou
**Processing trajectory calculations** I need to resolve the projectile problem involving a ball being hit at a speed of 36 km/h horizontally and 1.75 meters high. The ball reaches the batter after 0.5 seconds with no vertical velocity. After hitting, the vertical component is 22.5 km/h upward but gravity impacts the motion. Total time in the air is 1.75 seconds, with a peak height of about 3.7 meters. I need to reassess the graph options since the maximum heights don’t align with calculations.**Analyzing projectile motion** I think I might need to clarify the time scale with the ball’s initial speed of 36 km/h (10 m/s), which reaches the catcher after 0.5 seconds. The ball starts at a height of 1.75 meters, and it’s clear that before impact, the vertical motion drops to around 0.5 meters. So gravity is acting on it, causing the drop. After impact, the ball’s speed becomes 45 km/h at a 30° angle, giving a vertical component of 6.25 m/s upward.**Calculating motion parameters** I need to find the maximum height after impact, which appears to be 2.453m. I’m graphing a parabola that starts at (0,1.75) and drops to (.5,.5), where the vertical velocity (vy) goes from 0 to -5. At .5, it jumps to +6.25 and slopes down to -6.25 at t=1.75. I’m comparing options to see which graphs match the expected motion—looks like option A makes the most sense based on my analysis.**Analyzing motion graphs** I’m evaluating the velocity of object D, which seems to peak at +10 before declining to 0 by 1.5 seconds. That doesn't seem accurate. Meanwhile, after checking the horizontal distance, I've determined the drop due to gravity to be 1.25m. The vertical velocity after collision is 12.5 m/s, allowing for a total rise of 1.953m, reaching a max height of 2.453m. I think option A fits best with the graphs' expectations, especially around time 1.75.

A velocidade horizontal inicial é 36\ \text{km/h}=10\ \text{m/s}. Assim, a bola chega ao rebatedor após

t=\frac{5}{10}=0{,}5\ \text{s}.

Até esse instante, sua velocidade vertical inicial é zero e a gravidade a faz cair \tfrac12gt^2=1{,}25\ \text{m}. Portanto, ela chega à altura 1{,}75-1{,}25=0{,}50\ \text{m}, com velocidade vertical -gt=-5\ \text{m/s}.

Após a rebatida, a componente vertical da velocidade é

v_y=45\ \text{km/h}\,\sin30^\circ=6{,}25\ \text{m/s}.

A partir daí, v_y diminui linearmente com inclinação -g=-10\ \text{m/s}^2. A bola atinge o ponto mais alto 0{,}625\ \text{s} depois da rebatida e retorna à altura de 0{,}50\ \text{m}, descendo, 1{,}25\ \text{s} depois: no instante total 1{,}75\ \text{s}.

O gráfico que representa esses valores e o salto instantâneo de v_y na rebatida é o da alternativa A.

Resposta: A

Claude Fable 5.1

E

Respondeu

levou 16 s

Como pensou
I'm converting 36 km/h to 10 m/s horizontal, finding the fall takes 0.5 s to cover 5 m, giving a height drop of 1.25 m so y = 0.5 m, with vertical velocity -5 m/s at impact. Then after the bounce at 45 km/h (12.5 m/s) at 30°, I'm computing the new vertical component as 6.25 m/s to figure out when it's caught. Solving the trajectory equation, I find it's caught at y = 1.75 m at t = 1.5 s total (0.5 s before impact, 1 s after), descending with final vy = -3.75 m/s; max height reaches 2.45 m at t = 1.125 s. Checking the options, this matches E — the trajectory starts at vy = 6.25, ends at vy = -3.75, at y = 1.75, t = 1.5 s, ruling out D, A, and C.

Primeira fase (antes da rebatida):

  • Velocidade horizontal: 36 km/h = 10 m/s.
  • Tempo para percorrer 5 m: t₁ = 5/10 = 0,5 s.
  • Queda vertical: Δy = ½·10·(0,5)² = 1,25 m → y = 1,75 − 1,25 = 0,50 m.
  • Velocidade vertical nesse instante: v_y = −g·t = −5 m/s.

Segunda fase (após a rebatida):

  • Velocidade: 45 km/h = 12,5 m/s a 30° → v_y = 12,5·sen 30° = 6,25 m/s (salto descontínuo de −5 para +6,25 m/s no gráfico de v_y).
  • Altura máxima: y_máx = 0,5 + (6,25)²/(2·10) ≈ 0,5 + 1,95 = 2,45 m, em t = 0,5 + 0,625 ≈ 1,125 s.
  • Instante em que volta a 1,75 m (descendo): 1,75 = 0,5 + 6,25·t − 5t² → t² − 1,25t + 0,25 = 0 → t = 1,0 s (raiz descendente; a outra, 0,25 s, é na subida).
  • Tempo total: 0,5 + 1,0 = 1,5 s.
  • Velocidade vertical final: v_y = 6,25 − 10·1,0 = −3,75 m/s.

Comparando com os gráficos:

  • A: termina em y = 0,5 m (errado, deve terminar em 1,75 m).
  • B: escala e valores de v_y (≈11 m/s) incompatíveis.
  • C: rebatida em t ≈ 0,75 s (errado, é em 0,5 s).
  • D: v_y após a rebatida ≈ 10 m/s e termina em v_y ≈ 0 (errado).
  • E: rebatida em 0,5 s com y = 0,5 m, v_y saltando de −5 para ≈ 6,25 m/s, altura máxima ≈ 2,45 m, término em t = 1,5 s com y = 1,75 m e v_y ≈ −3,75 m/s. Tudo coincide.

Resposta: E

Claude Opus 5.5

E

Respondeu

levou 12 s

Como pensou
Starting with a 10 m/s horizontal launch from 1.75 m height, it takes 0.5 s to travel the 5 m, dropping 1.25 m so it's at 0.5 m with vy=-5 m/s at impact. After bouncing at 45 km/h (12.5 m/s horizontal, 6.25 m/s vertical up), I'm finding the max height reaches 0.5 + 6.25²/20 ≈ 2.45 m, occurring at t=1.125 s. Then descending from that peak, it falls 0.703 m to reach catch height of 1.75 m, taking about 0.375 s more, giving total time ≈1.5 s and vy at catch ≈ -3.75 m/s, pointing to option E.

Resposta: E, pois é a única alternativa com y caindo de 1,75 m a 0,5 m até 0,5 s, subindo a cerca de 2,45 m e voltando a 1,75 m em 1,5 s, e com vy indo de 0 a −5 m/s, saltando para +6,25 m/s e terminando em −3,75 m/s.

1ª fase (lançamento horizontal):

  • A velocidade horizontal é v = 36 km/h = 10 m/s.
  • O tempo para percorrer 5 m é t = 5/10 = 0,5 s.
  • A queda nesse tempo é Δy = ½·10·(0,5)² = 1,25 m, logo y = 1,75 − 1,25 = 0,5 m.
  • A velocidade vertical nesse instante é vy = −10·0,5 = −5 m/s.

2ª fase (após a rebatida):

  • A nova velocidade é v = 45 km/h = 12,5 m/s.
  • A componente vertical é vy = 12,5·sen30° = +6,25 m/s. No gráfico de vy, há um salto de −5 para +6,25 m/s em t = 0,5 s.
  • O tempo de subida é 6,25/10 = 0,625 s, então a altura máxima ocorre em t ≈ 1,125 s.
  • A altura máxima é y = 0,5 + 6,25²/20 ≈ 0,5 + 1,95 ≈ 2,45 m.
  • Para descer de 2,45 m até 1,75 m, a queda é de cerca de 0,70 m. Isso leva t = √(2·0,70/10) ≈ 0,375 s.
  • O instante da captura é t ≈ 1,125 + 0,375 = 1,5 s.
  • A velocidade vertical na captura é vy = −10·0,375 = −3,75 m/s.

Comparação com as alternativas: a curva y(t) vai de 1,75 m a 0,5 m (em 0,5 s), sobe até cerca de 2,45 m e volta a 1,75 m em 1,5 s. A curva vy(t) vai de 0 a −5 m/s, salta para +6,25 m/s e termina em −3,75 m/s em 1,5 s. Isso corresponde exatamente à alternativa E. A alternativa D termina vy em 0 e salta para cerca de 10 m/s, por isso não serve.

Resposta: E

Claude Sonnet 5.5

E

Respondeu

levou 10 s

Como pensou
At 10 m/s horizontal speed covering 5 m takes 0.5 s, dropping from 1.75 m by 1.25 m to 0.5 m height with a downward velocity of 5 m/s at that point. Then the ball gets hit at 12.5 m/s at a 30° angle, giving vertical and horizontal components of 6.25 and 10.83 m/s, and I'm calculating the rise time of 0.625 s to find the extra height gained. Working through the trajectory, the ball peaks around 2.45 m at t=1.125 s, then falls back to the 1.75 m reference height after another 0.375 s, making the total time 1.5 s with a final vertical velocity near -3.75 m/s. Checking against the graphs, option E matches this pattern — vy jumping to 6.25 at the hit and ending around -3.75, while option A incorrectly shows the ball caught at 0.5 m height instead. So E is the right answer.

Resolução

Antes da rebatida (0 a 0,5 s):

  • A velocidade horizontal é 36 km/h = 10 m/s.
  • Para percorrer 5 m na horizontal, a bola leva t = 5/10 = 0,5 s.
  • Nesse tempo, ela cai h = ½·10·(0,5)² = 1,25 m. A altura passa de 1,75 m para 0,5 m.
  • A velocidade vertical vai de 0 a −5 m/s.

Rebatida (t = 0,5 s):

  • A velocidade é 45 km/h = 12,5 m/s, a 30° com a horizontal.
  • Então v_y = 12,5·sen 30° = 6,25 m/s, para cima. Há um salto de −5 para +6,25 m/s no gráfico de v_y.

Após a rebatida:

  • A bola sobe durante 6,25/10 = 0,625 s, ou seja, até t = 1,125 s.
  • O ganho de altura é 6,25²/20 ≈ 1,95 m, e o máximo é y ≈ 0,5 + 1,95 ≈ 2,45 m.
  • Descendo de 2,45 m até 1,75 m, a bola cai 0,70 m, o que leva t = √(0,70/5) ≈ 0,375 s.
  • A bola é pega em t ≈ 1,5 s, com y = 1,75 m e v_y = −10·0,375 ≈ −3,75 m/s.

Comparação com as alternativas:

  • O gráfico deve ter o mínimo de y = 0,5 m em t = 0,5 s.
  • O máximo deve ser ≈ 2,45 m em t ≈ 1,1 s.
  • O final deve ser em t = 1,5 s, com y = 1,75 m e v_y ≈ −3,75 m/s.

Isso corresponde à alternativa E. As demais falham:

  • A termina com y = 0,5 m e em t ≈ 1,75 s.
  • B tem máximo de y muito maior.
  • C tem a rebatida em 0,75 s.
  • D tem v_y inicial após a rebatida de aproximadamente 10 m/s.

Resposta: E

Grok 4.7

E

Respondeu

levou 3 min 01 s

Como pensou
The problem is in Portuguese about a baseball throw. The ball is thrown horizontally at 36 km/h from 175 cm. After 5 m it is hit at 45 km/h at 30°. It lands at 175 cm. I will solve this step by step. Converting units: 36 km/h equals 10 m/s. The ball reaches the batter in 0.5 s. During this phase the vertical velocity is zero and gravity acts downward. The ball drops 1.25 m during the first phase. It hits at 0.5 m height with a vertical velocity of -5 m/s. After the hit, the velocity becomes 12.5 m/s at 30°. The horizontal component is about 10.8 m/s and the vertical component is 6.25 m/s upward. The graphs should show a jump in vertical velocity from -5 to positive values near 0.5 s. The vertical velocity should decrease linearly with slope -10 m/s². The ball is caught while descending at 175 cm, so its vertical velocity must be negative at that moment. I am now comparing the options to find the correct graphs. The ball reaches its maximum height 0.625 s after the hit, when vertical velocity becomes zero. The trajectory then descends back to the ground. The maximum height reached after the hit is about 2.45 m. The ball then falls back to 175 cm in roughly 0.375 s. The total time from the hit until the catch is one second. The vertical velocity at the moment of catching is -3.75 m/s. The total time from the initial throw until the catch is 1.5 s. The ball passes through 175 cm at 0.25 s while ascending and again at 1.5 s while descending. I am now matching these exact kinematic points against the provided graph options. Option A is incorrect because the ball would land at 0.5 m instead of 1.75 m. Option B is also wrong; its vertical velocity jump and final value do not match the calculated -3.75 m/s. Option C is incorrect because the ball would hit at 0.7 s instead of 0.5 s. Option D matches the trajectory: it starts at 1.75 m, drops to 0.5 m at 0.5 s, reaches a maximum near 2.5 m at 1.1 s, and returns to 1.75 m at 1.5 s. Option D is incorrect because its vertical velocity would end at zero, not at the calculated -3.75 m/s. Option E matches both the position and velocity graphs correctly. Option D appears inconsistent. If the vertical velocity jumps to 10 m/s, the ball should reach a maximum height of 5.5 m, but the graph shows a peak near 2.5 m. All options except B use the same y-axis scale from 0 to 2.5. The velocity and position graphs in option E are physically consistent. The vertical displacement of 1.25 m over one second matches the calculated change, and the maximum height of roughly 2.45 m aligns with the graph.

A velocidade inicial horizontal da bola é 36\,\mathrm{km/h}=10\,\mathrm{m/s} e a altura inicial é 1{,}75\,\mathrm{m}. O tempo até o rebatedor é portanto 5/10=0{,}5\,\mathrm{s}. Nesse intervalo a componente vertical da velocidade passa de 0 a -5\,\mathrm{m/s} e a altura cai para 0{,}5\,\mathrm{m}.

No instante do golpe a velocidade passa a ser 45\,\mathrm{km/h}=12{,}5\,\mathrm{m/s} a 30^\circ com a horizontal, de modo que

v_y=12{,}5\cdot\sin 30^\circ=6{,}25\,\mathrm{m/s}.

A partir daí a bola sobe e desce sob a_y=-10\,\mathrm{m/s}^2. Ela retorna à altura 1{,}75\,\mathrm{m} (agora em movimento descendente) no instante t=1{,}5\,\mathrm{s}, quando v_y\approx-3{,}75\,\mathrm{m/s}. A altura máxima atingida é aproximadamente 2{,}45\,\mathrm{m}.

Somente os gráficos da alternativa E reproduzem simultaneamente:

  • a descontinuidade de v_y em t=0{,}5\,\mathrm{s} (de -5\,\mathrm{m/s} para \approx 6\,\mathrm{m/s});
  • o retorno a y=1{,}75\,\mathrm{m} em t=1{,}5\,\mathrm{s} com v_y<0;
  • a altura máxima próxima de 2{,}5\,\mathrm{m}.

As demais alternativas apresentam tempo de voo, valor de v_y após o golpe, altura final ou sinal de v_y no instante da defesa incompatíveis com o movimento descrito.

Resposta: E

DeepSeek V4.1 Flash

C

Respondeu

levou 39 s

Como pensou
Precisamos resolver uma questão de física cinemática. Temos duas imagens: a primeira com constantes físicas, a segunda com enunciado e alternativas. A questão fala de beisebol: lançamento horizontal, rebatida, defensor pega bola. Precisamos escolher gráficos de posição y(t) e velocidade vertical vy(t). Vamos analisar cuidadosamente. Enunciado: "Em um treino de beisebol, uma bola é lançada por um arremessador com uma velocidade horizontal de 36 km/h, a uma altura de 175 cm do solo. Após percorrer uma distância horizontal de 5 m, ela é atingida pelo rebatedor e passa a ter, instantaneamente, uma velocidade de 45 km/h, formando um ângulo de 30° com a horizontal. Ela realiza sua trajetória até ser pega em movimento descendente por um defensor a uma altura de 175 cm acima do solo. Assinale a alternativa que apresenta os gráficos cinemáticos de posição (y) e velocidade vertical (vy) da bola, conforme a descrição acima." Temos que analisar. Dados: - Lançamento inicial pelo arremessador: velocidade horizontal v0x = 36 km/h = 10 m/s. Altura inicial y0 = 175 cm = 1,75 m. Lançamento horizontal, então velocidade vertical inicial v0y = 0. - Ela percorre distância horizontal de 5 m até ser atingida pelo rebatedor. Nesse intervalo, movimento é projétil sob gravidade: y(t) = y0 - (1/2) g t^2, x(t) = v0x t. Tempo até rebatida: t1 = 5 m / 10 m/s = 0,5 s. Nesse instante, altura y1 = 1,75 - (1/2)*10*(0,5)^2 = 1,75 - 5*0,25 = 1,75 - 1,25 = 0,5 m. Ou seja, a bola cai de 1,75 m para 0,5 m em 0,5 s. Gráfico y(t) começa em 1,75 m, decresce até 0,5 m em t=0,5 s. Formato parábola (concavidade para baixo) no primeiro trecho. - No instante da rebatida, a velocidade passa a ser 45 km/h = 12,5 m/s, formando ângulo de 30° com a horizontal. Provavelmente ela é rebatida no sentido oposto? Precisamos ver. O enunciado diz "passa a ter, instantaneamente, uma velocidade de 45 km/h, formando um ângulo de 30° com a horizontal." Não especifica direção (para cima? para baixo? para frente?). Mas "formando um ângulo de 30° com a horizontal" e ela realiza sua trajetória até ser pega em movimento descendente. A bola é rebatida; provavelmente a velocidade tem componente vertical para cima (pois após a rebatida ela sobe? Vamos ver gráficos). Poderia ser para cima (ângulo de 30° acima da horizontal). A componente vertical vy no instante da rebatida seria v0y' = 45 km/h * sen(30°) = 12,5 * 0,5 = 6,25 m/s. Para cima. Mas precisamos verificar o sinal nos gráficos. No gráfico de vy, no instante t=0,5 s, há um salto. A alternativa A: vy começa 0, decresce até -5 em t=0,5 s, então salto para +6,25? Mas o gráfico A mostra vy após t=0,5 s começando em 5? Vejamos: eixo y de vy de -10 a 10; no gráfico A, antes de 0,5 s, vy parece uma reta de 0 até -5 (em t=0,5 s), então salto vertical até +6? A linha após 0,5 s começa em torno de 6? Sim, aproximadamente 6,25? Mas o eixo tem marcas de 5 e 10? A linha após salto parece começar em 6, mas o eixo y (vy) está com escala: 0, 5, 10? Na imagem A, à direita, as marcas: 0, 5, 10? Não tem -5? Tem -10, -5, 0, 5, 10? O eixo y do segundo gráfico (velocidade vertical) tem marcas: -10, -5, 0, 5, 10. A linha antes de 0,5 s vai de 0 a -5 (exatamente -5) em t=0,5. Após 0,5 s, linha começa em +6,25? O gráfico mostra ponto em torno de 6? Pode ser 6,25? Mas o eixo marca 5 e 10; a linha após salto está um pouco acima de 5, talvez 6,25. Então A está consistente com vy(t) = 0 - g t = -10 t no primeiro trecho, em t=0,5 vy=-5 m/s. Após rebatida, vy(t) = 6,25 - 10 (t - 0,5) para t >=0,5? Espera: após rebatida, a aceleração continua -g = -10 m/s². Então vy(t) = 6,25 - 10*(t - 0,5) = 6,25 -10t +5 = 11,25 -10t? Em t=0,5, vy=6,25. Em t=1,0, vy=1,25? Em t=1,5, vy=-3,75? Em t=1,75, vy=-6,25? Nos gráficos, a linha após 0,5 s desce até cerca de -5? Em A, após 0,5 s até t~1,75, termina em ~ -5? y final? A bola é pega em movimento descendente a uma altura de 175 cm = 1,75 m acima do solo. Ou seja, a altura final é 1,75 m (mesma do lançamento). Como a bola é rebatida em y=0,5 m e precisa voltar a y=1,75 m em movimento descendente? Mas y final é 1,75 m, mesma do arremessador. A trajetória após rebatida: começa em y=0,5 m, sobe até um máximo e depois desce até y=1,75 m (que é mais baixo que o máximo? Se y final é 1,75 m, mas partiu de 0,5 m e sobe... o máximo deve ser >1,75 m? Vamos calcular). A componente vertical inicial 6,25 m/s. Em t=0,5 + Δt, y(t)=0,5 + 6,25 Δt -5 Δt². Em qual instante y=1,75 m? 0,5 + 6,25 Δt -5 Δt² =1,75 => 6,25 Δt -5 Δt² =1,25 => dividindo 1,25: 5 Δt -4 Δt² =1 => 4 Δt² -5 Δt +1=0 => Δt = [5 ± sqrt(25-16)]/(8) = [5 ±3]/8 => Δt=1 ou Δt=0,25? Não. Δt=1? 8? (5+3)/8=1. (5-3)/8=0,25. Δt=0,25 s: subindo? Derivada vy=6,25 -10*0,25=3,75>0, então movimento ascendente. Altura 1,75 m em t=0,75 s (subindo). Δt=1 s: descendo? vy=6,25-10= -3,75<0, então movimento descendente. Altura 1,75 m em t=1,5 s. O enunciado diz "até ser pega em movimento descendente por um defensor a uma altura de 175 cm acima do solo." Portanto tempo total = 0,5 + 1 = 1,5 s. Então a bola é pega em t=1,5 s, com vy = -3,75 m/s? Vamos verificar gráficos: alternativa A tem tempo total até ~1,7? Não, gráfico y A termina em t~1,7? Na verdade, o eixo x do gráfico y A vai de 0,0 a 2,0; a curva termina em torno de 1,7? A linha y termina em y=0,5? Não, y final é 1,75? Em A, y final parece 0,5? Hmm gráfico y A: após máximo, desce até altura 0,5? O ponto final parece y ~0,5, t ~1,75? Não, a linha após máximo desce e termina em y=0,5? Vou olhar: os gráficos y mostram uma curva que começa em y=1,75, cai até y=0,5 em t=0,5, sobe até máximo ~2,45 em t~1,1, desce e termina em t~1,7 com y~0,5? Mas o enunciado diz que é pega a 1,75 m. Então o gráfico y deveria terminar em y=1,75, não 0,5. Vejamos alternativa C: y final termina em ~1,75? Gráfico C y: começa 1,75, cai para 0,5 em 0,5, sobe até ~2,45 em t~1,0, desce até ~1,75 em t~1,5? Sim, o gráfico C termina em y~1,75, t~1,5. A alternativa A termina em ~0,5? Vou comparar: A e C são semelhantes? A x final ~1,7 e y final ~0,5; C x final ~1,5 e y final ~1,75? Preciso ver. Na imagem, A y: curva vai até x=2,0? Não, a curva termina antes de x=2,0? Está desenhada até y=0,5? A parte final da curva em A toca o eixo? Acho que A termina em y=0,5 em t~1,75? C termina em y=1,75 em t~1,5? C é a correta? Vamos analisar todas alternativas. O primeiro trecho: todos os gráficos y começam em 1,75 e caem para 0,5 em t=0,5. Ok. Segundo trecho: y parte de 0,5, sobe até máximo, depois desce até 1,75 no instante t=1,5. O gráfico de vy: no instante t=0,5, salto de -5 para +6,25. Depois reta decrescente com inclinação -10. Em t=1,5, vy = 6,25 -10*(1,0) = -3,75? Mas precisamos confirmar se o gráfico de vy mostra reta após salto com valor final -3,75? Nas alternativas, algumas retas após salto terminam em y=0 em t=1,5, outras terminam em -5? Vamos checar. Alternativa C: segundo gráfico (vy) antes de 0,5: reta de 0 a -5? Em t=0,5, vy = -5. Após 0,5: reta começa em +6,25 e desce; em t=1,5, vy ~ -3,75? Na escala, entre 0 e -5? O gráfico C mostra a reta após salto começando em ~6 e terminando em ~ -3,75? O eixo tem marcas; a linha final parece estar entre -5 e 0, consistente com -3,75. Sim. Alternativa A: vy após salto começa em ~6 e termina em ~ -3,75? Mas o gráfico A y termina em t~1,7? Não. Vamos analisar tempo total. Tempo total desde lançamento: t1=0,5 s; t2=1,0 s; total 1,5 s. Portanto os gráficos corretos devem ter eixo x até 1,5 s (1,5). Alternativa A gráfico x vai até 2,0; a curva termina em ~1,75? Mas o tempo total não seria 1,5? Em A, a curva y após máximo desce até y=0,5 em t~1,7, não 1,75? Se fosse y final 0,5, tempo para y=0,5 descendo? Vamos calcular: 0,5 + 6,25 Δt -5 Δt² =0,5 => 6,25 Δt -5 Δt² =0 => Δt(6,25 -5 Δt)=0 => Δt=0 (partida) ou Δt=1,25 s. Total t=1,75 s. Então se a bola fosse pega a 0,5 m, tempo total seria 1,75 s. Mas o enunciado diz pega a 1,75 m, então tempo total 1,5 s. Então A estaria errada porque termina em y=0,5? Mas A y final parece ~0,5? Sim, alternativa A: y final no gráfico parece ~0,5 (em torno de 0,5). C: y final ~1,75? C y final parece 1,75? Vou olhar novamente: C y: o ponto final está em y ~1,75, t~1,5? A curva termina exatamente no nível da linha horizontal inicial? A imagem mostra que a curva final de C está na altura da linha y=1,75? Sim, parece voltar ao mesmo nível inicial (1,75). Isso condiz. Também precisamos analisar a componente horizontal? Não, a questão pede gráficos de posição y e velocidade vertical vy. A posição y é apenas vertical. A velocidade horizontal não influencia y(t) (a componente vertical é independente), exceto que a trajetória é parabólica no primeiro trecho. No segundo trecho, também é projétil. A velocidade vertical vy(t) tem descontinuidade no instante da rebatida: antes: vy = -g t = -10 t (para t de 0 a 0,5), em t=0,5 vy=-5 m/s. Após: vy = v0y' - g (t - 0,5) para t≥0,5, com v0y'=45 km/h * sen30 = 12,5 * 0,5 = 6,25 m/s. Então vy(t) = 6,25 -10(t-0,5) = 11,25 -10t. Em t=1,5, vy = 11,25 -15 = -3,75 m/s. Portanto, no gráfico vy, após 0,5 s, a reta parte de +6,25 e termina em -3,75 em t=1,5. Nenhum gráfico mostra exatamente esses valores? Vamos conferir escalas. As alternativas A, C, D, E têm curvas similares no y? Vou listar: A: y primeiro trecho cai a 0,5 em 0,5; sobe a ~2,4; desce a ~0,5 em ~1,7. vy: antes -5; após salto para ~6; após reta desce até ~ -3,75? Em t=1,7? Mas A termina t~1,7; vy em t=1,7 = 11,25 -17 = -5,75? Não. A reta final de vy A parece terminar em -5? O eixo y tem marca -5; a linha final toca -5? Sim, em t=1,7 a reta poderia terminar em -5? Se t=1,7, vy = 11,25 -17 = -5,75, mas talvez escala? Não. A alternativa A mostra a reta após salto começando em 6 e terminando em -5 em t=1,7? Vou ver a imagem: A vy: antes de 0,5, reta até -5. Após salto, reta começa em ~6 e termina em ~ -3,75? Mas a linha final em A parece terminar em y=-5? Na imagem A, o final da reta está em y=-2,5? Difícil. Mas o principal: t final em A é ~1,75 s, então y final ~0,5. Como o enunciado diz altura final 1,75, A errada. B: y começa em 1,75? B gráfico y: começa em 1,75? A curva inicial sobe? Não, B y: começa em 1,75, cai até ~0,5 em t=0,5; depois sobe até ~6,2 em t=1,5? e desce até ~1,75 em t=2,5? Pré-requisito? B parece ter segundo trecho com máximo muito mais alto (6 m) e tempo maior (t=2,5). Isso não confere: se v0y' = 12,5? Na verdade, poderia ser 45 km/h = 12,5 m/s, componente vertical = 12,5 sen30 = 6,25 m/s. Altura máxima a partir de y=0,5: Δh = v0y'^2/(2g) = (6,25)^2/20 = 39,0625/20 = 1,953125 m. Altura máxima y_max = 0,5 + 1,953 = 2,453 m. Então não chega a 6 m. B está errada. C: y: começa em 1,75, cai a 0,5 em 0,5, sobe até ~2,45, desce até 1,75 em t=1,5. Isso confere! vy: antes reta de 0 a -5 em 0,5; após salto começa em +6,25? Gráfico C vy mostra após salto começando em ~6,25 e descendo; em t=1,5, vy ~ -3,75? Sim. C parece correta. D: y: começa em 1,75, cai a 0,5 em 0,5, sobe até ~2,45, desce até ~1,75 em t=1,5? Mas o gráfico D y: a curva após máximo desce e termina em y~1,75? Vou comparar C e D: C y e D y parecem idênticos? Há diferença: em D, o gráfico y após o máximo desce e termina exatamente em y=1,75? Em C também? Vou ver detalhes: C y final em t~1,5 e y~1,75; D y final em t~1,6? Na verdade, D y: a curva após máximo desce até y~1,75, mas com t~1,5? Precisamos ver a segunda coluna (vy). D vy: antes -5; após salto para ~6,25; desce até ~0? Em t=1,5, vy~ -2,5? Não, D gráfico vy: após salto, a reta termina em y=0 em t=1,5? A linha final toca o zero? Vamos ver a descrição: alternativa D ( ) tem gráfico y com máximo, desce até y≈1,75? E vy após salto desce até 0 em t=1,5? Se vy final = 0, então no instante em que é pega, a velocidade vertical é zero (ponto mais alto? Mas seria pega no ponto mais alto? O enunciado diz movimento descendente, então vy < 0, não zero). Portanto D errada. E: y: começa em 1,75, cai a 0,5 em 0,5; mas depois sobe até ~2,45 e desce até ~1,75 em t~1,8? Ou t~1,5? E vy: após salto, a reta desce e termina em ~ -2,5? Vamos analisar E. E gráfico y: parece semelhante a D? O y final de E está em y~1,75? Mas gráfico y em E tem eixo x até 2,0; a curva termina em t~1,75? A forma é diferente? E y: após a queda inicial, sobe até máximo, depois desce; parece que o tempo total é maior (~1,75). E vy: após salto, reta começa em ~6 e desce até ~ -2,5 em t~1,75? Não. Precisamos decidir entre C e D (e talvez E). A diferença crucial: tempo total e velocidade final. Vamos calcular tempo total exato: t_total = 0,5 + 1,0 = 1,5 s. A altura final é 1,75 m. A velocidade vertical ao ser pega: no instante t=1,5, vy = 6,25 - 10*(1,0) = -3,75 m/s. Ou seja, -3,75 m/s, não zero, não -5. Nos gráficos, qual alternativa mostra vy final ~ -3,75 em t=1,5? Alternativa C: vy após salto termina em t=1,5 no ponto y=-3,75? Vou olhar a imagem: C vy: a linha após 0,5 s começa em ~6,25 e desce até y=-5? Ou -3,75? O eixo tem marcas -10, -5, 0, 5, 10. A linha final está entre 0 e -5, mais perto de -5? -3,75 está entre 0 e -5, mais próximo de -5? -3,75 é 3/4 do caminho de 0 a -5. Na imagem, a linha final de C vy parece estar em ~ -3,75? Sim, um pouco acima de -5. Em A, a linha final está em ~ -5? A linha final de A vy parece tocar -5. Em C, a linha final está acima de -5 (talvez -3,75). Isso confere. Também conferir o instante do máximo (vértice) no gráfico y. Após a rebatida, o tempo para atingir altura máxima é t_subida = v0y'/g = 6,25/10 = 0,625 s após a rebatida. Como a rebatida ocorre em t=0,5, o máximo ocorre em t=1,125 s. Nos gráficos, alternativa C: o máximo ocorre em t~1,1? Sim, o pico parece em torno de 1,1 s. O tempo total até y=1,75 descendo: t = 0,5 + (6,25 + sqrt(6,25^2 -2g(y_f - y_i)?)) / g? Vamos resolver: y = y0' + v0' t' - (1/2)g t'^2 = 1,75, com y0'=0,5, v0'=6,25. Equação: 0,5 + 6,25 t' -5 t'^2 =1,75 => 5t'^2 -6,25t' +1,25 =0. Resolvendo: t' = [6,25 ± sqrt(39,0625 -25)]/10 = [6,25 ± sqrt(14,0625)]/10 = [6,25 ± 3,75]/10. t' = 1,0 s ou 0,25 s. Descendo: t'=1,0 s. Total t=1,5 s. Então o gráfico y deve retornar a 1,75 m exatamente em t=1,5 s. Alternativa C: o gráfico y termina em t=1,5? A curva final em C parece terminar em t~1,5? Sim, marca 1,5 no eixo x. E final y=1,75. Alternativa D: a curva y termina em t~1,6? No gráfico D, a curva final parece estar em t~1,6? Não, eixo x está marcado 0,0; 0,5; 1,0; 1,5; 2,0. A curva D termina em t~1,5? Vou comparar C e D: C y final está exatamente na linha vertical t=1,5? D y final está um pouco depois? A diferença entre C e D pode estar no tempo total: C y final em t=1,5, D y final em t=1,6? O gráfico D y: a curva desce até y=1,75 em t~1,6? Observando, em C, ponto final está em t~1,5; em D, ponto final está em t~1,6? Talvez D tenha tempo total 1,6? O enunciado: "até ser pega em movimento descendente por um defensor a uma altura de 175 cm". Pode ser que a bola não seja pega no mesmo nível? Mas a altura é 175 cm = 1,75 m. Então tempo total deve ser 1,5. A alternativa E parece ter tempo total ~1,75? E y final em t~1,7? Vou olhar E: y final em t~1,75, y~1,75? Possível. E vy final em t~1,75, vy=-5? Não. Outra forma: comparar os gráficos y com a equação: no segundo trecho, a função y(t) = 0,5 + 6,25 (t-0,5) -5(t-0,5)^2. Derivando: vy(t)=6,25 -10(t-0,5). A raiz de y(t)=1,75 tem t=0,75 (subindo) e t=1,5 (descendo). Então a curva y deve passar por y=1,75 em t=0,75 e t=1,5. No gráfico y, podemos verificar se a curva toca y=1,75 na subida? O ponto inicial é y=0,5, não toca 1,75 na subida? Sim, a curva sobe a partir de 0,5 e atinge 1,75 em t=0,75, continua subindo até 2,45 e desce, cruzando 1,75 novamente em t=1,5. Portanto o gráfico y deve ter uma parte inicial subindo que cruza y=1,75 (antes do máximo). Mas todos os gráficos mostram a curva subindo de 0,5 a 2,45 diretamente, talvez cruzando 1,75 em t~0,75. Não é fácil distinguir. A diferença crucial entre C e D pode estar na segunda coluna. Vamos inspecionar D vy: antes de 0,5: reta de 0 a -5? Em D, vy após salto começa em ~6,25 e desce, mas termina em 0 em t~1,5? Na imagem D, a reta após salto termina em y=0 em t~1,5? Sim, o final da linha D vy está no eixo zero. Isso significaria vy=0 no instante da captura, ou seja, a bola é pega no ponto mais alto (movimento não descendente). Mas o enunciado diz "movimento descendente", então vy deve ser negativo. Portanto D errada. A alternativa E: vy final talvez -2,5? y final talvez 1,75? Precisamos ver o tempo total. E y: tempo total ~1,7? Vou calcular se a bola fosse rebatida e depois pega em y=1,75 descendo, tempo total 1,5. Se o gráfico E mostra tempo total >1,5, errado. E y final em t~1,7, y~1,75? Então o tempo seria 1,7, o que implicaria altura final menor? Na verdade, se t=1,7, y = 0,5 +6,25*1,2 -5*1,44 =0,5 +7,5 -7,2=0,8 m, não 1,75. Errado. Então E também errada? A alternativa E no gráfico vy parece ter reta após salto começando em ~6 e terminando em -5 em t~1,7? Mas y final? Não. Precisamos verificar as alternativas com cuidado. A questão provavelmente tem uma correta: C. Mas vamos confirmar todos os detalhes. 1. Lançamento: velocidade horizontal 36 km/h = 10 m/s. Altura 175 cm. Tempo até rebatida: d=5 m, t=5/10=0,5 s. Nesse tempo, a bola cai: y=1,75 -5t^2 =1,75 -5*0,25 =1,75 -1,25 =0,5 m. Todos os gráficos y têm primeiro trecho assim? Sim, A, C, D, E, B têm y inicial 1,75 e mínimo 0,5 em 0,5. B também? B y inicial 1,75 e mínimo 0,5 em 0,5. Ok. 2. Rebatida: velocidade 45 km/h = 12,5 m/s, ângulo 30° com horizontal. A componente vertical inicial: 12,5 sen30 = 6,25 m/s para cima. Essa é a velocidade vertical imediatamente após a rebatida. No gráfico vy, deve haver um salto de -5 (antes) para +6,25 (depois). As alternativas A, C, D, E têm salto? A: salto de -5 para ~5? C: salto de -5 para ~6,25? D: salto de -5 para ~6,25? E: salto de -5 para ~6,25? B: salto de -5 para ~10? Não. Vamos olhar: B vy antes de 0,5: reta de 0 a -5? Em t=0,5, vy=-5; salto para +10? B após salto começa em ~10,5? Isso corresponderia a v0y=10,5 m/s, errado. Então B errada. 3. Tempo total: após rebatida, a bola sobe e desce até y=1,75 m. Tempo para retornar a y=1,75 m: resolvemos t'=1,0 s. Total t=1,5 s. A alternativa C tem eixo x até 1,5? Sim, o gráfico y e vy terminam em t=1,5. A alternativa A termina em t~1,7? A y final ~0,5? Se tivesse y final 1,75, poderia ser A? Mas o gráfico A y final está abaixo de 1,75? Vou comparar: A y final: a curva termina em y~0,5? O gráfico A tem eixo y de 0,0 a 2,5. A curva após máximo desce e termina em y=0,5 (um pouco acima do mínimo inicial? O mínimo inicial é 0,5; o final é 0,5? Na verdade, A y final parece 0,5). C y final: termina em y~1,75. Então C é a única com y final correto. 4. Velocidade final: após t'=1,0 s, vy = v0y' - g t' = 6,25 -10 = -3,75 m/s. O gráfico vy de C termina em -3,75? Sim, pode ser. O gráfico vy de D termina em 0? Não. O gráfico vy de A termina em -3,75? Mas y final de A é 0,5, então se o gráfico A tivesse vy final -3,75 e y final 0,5? Mas y e vy devem ser consistentes. Se y final 0,5, tempo total 1,75 s, vy final = 6,25 -10*1,25 = -6,25 m/s. O gráfico vy de A poderia terminar em -6,25? O eixo A vy tem marca -10, -5; a linha final parece em -5? Não sei. Mas a inconsistência é que A y final 0,5, não 1,75. Portanto A errada. 5. Verificar se a bola pode ser pega em y=1,75 m descendo: Sim, calculamos. 6. O instante do máximo: t=0,5+0,625=1,125 s. A alternativa C mostra máximo em t~1,1 s. Ok. 7. A altura máxima: y_max=0,5 + v0y'^2/(2g)=0,5 +6,25^2/20 =0,5 +39,0625/20 =0,5 +1,953125 =2,453125 m. Nos gráficos, máximo em torno de 2,45 m. A alternativa C y máximo ~2,45. Ok. 8. A forma da parábola no primeiro trecho: y(t)=1,75 -5t^2, de t=0 a 0,5. Derivada vy=-10t, em t=0,5 vy=-5. Ok. 9. Na rebatida, a velocidade vertical muda instantaneamente (salto no gráfico vy). As alternativas mostram uma linha vertical pontilhada? Sim, as alternativas A, C, D, E têm uma linha vertical em t=0,5. A linha vertical no gráfico vy vai de -5 a +6,25. Em C, a linha vertical parece ir de -5 para +6,25. Ok. 10. Por que não B? B y máximo ~6,2? Não, o enunciado não dá velocidade vertical tão alta (45 km/h =12,5 m/s; componente vertical 6,25). B estaria se a velocidade fosse 45 m/s? Não. Conclusão: alternativa C. Vamos preparar a explicação. A questão pede: "Assinale a alternativa que apresenta os gráficos cinemáticos de posição (y) e velocidade vertical (vy) da bola, conforme a descrição acima." Explicação: - Calcular tempo até a rebatida: t1 = 5 m / (36/3,6 m/s) = 5/10 = 0,5 s. - Altura nesse instante: y1 = 1,75 - (1/2)*10*(0,5)^2 = 1,75 -1,25 =0,5 m. - Velocidade vertical antes da rebatida: vy = -g t = -10t; em t=0,5, vy=-5 m/s. - Após a rebatida: velocidade 45 km/h = 12,5 m/s, ângulo 30°, componente vertical v0y = 12,5 sen30 = 6,25 m/s (para cima). - A partir de t=0,5, movimento vertical: y(t) = 0,5 + 6,25 (t-0,5) -5(t-0,5)^2, com vy(t)=6,25 -10(t-0,5). - Atinge novamente y=1,75 m quando 0,5 +6,25 Δt -5 Δt² =1,75 => 5Δt² -6,25Δt +1,25=0 => Δt=0,25 s (subindo) ou Δt=1,0 s (descendo). Como é pega em movimento descendente, Δt=1,0 s. Portanto t_total =1,5 s, e nesse instante vy = 6,25 -10*1,0 = -3,75 m/s. - O gráfico correto deve ter y iniciando em 1,75 m, caindo até 0,5 m em t=0,5 s; depois subindo até cerca de 2,45 m (máximo em t=1,125 s) e descendo até 1,75 m em t=1,5 s. O gráfico de vy deve ter reta decrescente de 0 a -5 m/s em t=0,5 s, salto vertical para +6,25 m/s, e depois reta decrescente até -3,75 m/s em t=1,5 s. A alternativa que contém esses gráficos é a C. Vou formular a resposta final. Mas antes, verificar se há uma pegadinha: "formando um ângulo de 30° com a horizontal" pode ser para baixo? Se fosse para baixo, a bola não subiria, mas o enunciado diz que realiza trajetória até ser pega em movimento descendente. Se a velocidade após rebatida fosse para baixo, ela já estaria descendente e não haveria subida; além disso, não voltaria a 1,75 m? Poderia, mas a trajetória seria apenas descendente. Mas os gráficos mostram subida (y aumenta após 0,5). Portanto ângulo para cima. Outra possibilidade: a altura de 175 cm é 1,75 m; o defensor pega a bola a 175 cm, então y final =1,75. Ok. Resposta: C. Vou escrever a explicação passo a passo e finalizar com "Resposta: C".
A bola é lançada horizontalmente a 36 km/h = 10 m/s, de uma altura y_0=1{,}75 m.
Até ser rebatida, ela percorre 5 m na horizontal. O tempo para isso é:

t_1=\frac{5}{10}=0{,}5\text{ s}

Nesse instante, a altura é:

y(0{,}5)=1{,}75-\frac12\cdot10\cdot(0{,}5)^2 =1{,}75-1{,}25=0{,}5\text{ m}

A velocidade vertical antes da rebatida é:

v_y=-10t \quad\Rightarrow\quad v_y(0{,}5)=-5\text{ m/s}

Após a rebatida, a velocidade passa a ser 45 km/h = 12,5 m/s, formando 30° com a horizontal. A componente vertical inicial é:

v_{0y}=12{,}5\,\text{sen}\,30^\circ=12{,}5\cdot0{,}5=6{,}25\text{ m/s}

A partir daí:

y(t)=0{,}5+6{,}25(t-0{,}5)-5(t-0{,}5)^2

A bola é pega em movimento descendente, novamente a 1,75 m. Resolvendo:

0{,}5+6{,}25\Delta t-5\Delta t^2=1{,}75
5\Delta t^2-6{,}25\Delta t+1{,}25=0
\Delta t=0{,}25\text{ s}\quad\text{ou}\quad\Delta t=1{,}0\text{ s}

Como está descendo, \Delta t=1{,}0 s. Portanto o tempo total é 1{,}5 s, e nesse instante:

v_y(1{,}5)=6{,}25-10(1{,}5-0{,}5)=-3{,}75\text{ m/s}

Assim, o gráfico correto deve mostrar:

  • y começando em 1,75 m, caindo para 0,5 m em t=0{,}5 s;
  • depois subindo até cerca de 2,45 m e retornando a 1,75 m em t=1{,}5 s;
  • v_y começando em 0, caindo para -5 m/s em t=0{,}5 s, com salto para +6{,}25 m/s e depois decaindo até -3{,}75 m/s em t=1{,}5 s.

Essas características correspondem à alternativa C.

Resposta: C

Gemini 3.8 Flash

E

Respondeu

levou 48 s

Como pensou
**Analyzing the Problem** I'm currently focused on dissecting this physics problem. The scenario involves a baseball pitch with a given horizontal velocity. I'm noting the initial conditions – horizontal speed and height – to establish a baseline for my calculations. I'll need to use these details to figure out the relevant physical principles at play here. This appears to be a projectile motion problem, so I'm thinking about how to frame it. **Calculating Projectile Trajectory** I've determined the initial conditions and time of flight before the ball is hit. Initial horizontal velocity is 10 m/s, and the initial vertical velocity is 0 m/s. The initial height is 1.75 m. The ball travels 5 m horizontally in 0.5 s before interaction. Now I need to calculate the vertical position at this time, y(0.5). **Evaluating the Graphs** I've calculated the vertical position and velocity of the baseball at the instant before the bat makes contact. I'm focusing on the graphs provided, comparing the calculated values to the provided options. I'm noting the jump in vertical velocity should occur precisely at t=0.5 s, using this analysis to eliminate incorrect options. The graphs that depict a jump at t=0.75 are wrong, so I'm honing in on the correct representation. **Calculating the New Velocity** I've just calculated the vertical component of the new velocity after the hit, finding it to be 6.25 m/s, at $t=0.5$ s, and $30^\circ$ angle with the horizontal. Now I'm comparing this value to the graphs. Graph A looks promising, with $v_y$ jumping from negative to around 6.25 m/s. I'm taking a closer look at Graph B and its higher jump, realizing the mistake of not multiplying by the angle, but its jump isn't matching my calculation. **Confirming Maximum Height** I've calculated the maximum height to be approximately 2.45 m and I'm cross-referencing this with the graphs. Graph A's peak height seems to align nicely, while Graph B's peak is definitely incorrect and a distractor, over 6 m. Graph C's jump at t=0.75 s is confusing. I also noticed how the time to reach the peak and its value matches Graph A perfectly. **Determining the Catch Time** I've just been calculating the full trajectory after the hit. Now I know the ball is caught at 1.5 s, at the same height as the initial position, 1.75 m. The final vertical velocity is -3.75 m/s. I'm focusing on those values now, and checking for which graphs show the end of motion. I see graph A still has issues, and I am going to see if any other detail is off. **Verifying Final Conditions** I'm now zeroing in on the catch conditions, making sure the trajectory correctly stops at 1.75 m. I see the importance of the vertical velocity's initial jump in graph D. I'm focusing on the final height and catch time details now. I'm realizing that the vertical velocity jump does not align with my calculations in graph D. I'm noting the differences in the vertical velocity axis for graph D versus graph E. I am now checking all parameters. **Confirming Trajectory Details** I've carefully re-examined graph E, which now appears correct. The y(t) graph starts at 1.75 m at t=0, reaches 0.5 m at t=0.5, goes up to 2.45 m at t=1.125, and correctly ends at t=1.5 with y=1.75 m. Graph A continues past 1.5, to 1.75 s with y=0.5. I've confirmed that the problem states the trajectory ends at 1.75 cm, which is accurately depicted in graph E, validating it. **Validating the Solution** I'm now carefully re-examining graph E and double-checking details. "Até ser pega" means the ball stops at 1.75 m and t=1.5 s, and this corresponds to graph E, and not to graph A. The details for this are now clear. The initial starting point and ending point of graph E are both accurate. I am now double-checking the right plots in graph E versus graph D, and noting the inconsistencies in D.

Para resolver a questão, vamos analisar a cinemática da bola dividida em duas etapas:


1ª Etapa: Do arremesso até a rebatida

  • Dados iniciais:

    • Velocidade inicial: apenas horizontal, logo:
      v_{0x} = 36\text{ km/h} = \frac{36}{3{,}6} = 10\text{ m/s}

      v_{0y} = 0\text{ m/s}
    • Altura inicial: y_0 = 175\text{ cm} = 1{,}75\text{ m}
    • Gravidade: g = 10\text{ m/s}^2
    • Distância horizontal percorrida até o rebatedor: \Delta x = 5\text{ m}
  • Tempo até o impacto (t_1):

    t_1 = \frac{\Delta x}{v_{0x}} = \frac{5}{10} = 0{,}5\text{ s}

  • Posição vertical e velocidade vertical no instante t = 0{,}5\text{ s} (imediatamente antes da rebatida):

    y(0{,}5) = y_0 - \frac{1}{2}gt_1^2 = 1{,}75 - \frac{1}{2}(10)(0{,}5)^2 = 1{,}75 - 1{,}25 = 0{,}50\text{ m}

    v_y(0{,}5^-) = -g t_1 = -10 \times 0{,}5 = -5\text{ m/s}


2ª Etapa: Da rebatida até a bola ser pega

  • Velocidade imediatamente após a rebatida:

    • Módulo: v = 45\text{ km/h} = \frac{45}{3{,}6} = 12{,}5\text{ m/s}
    • Ângulo de lançamento: \theta = 30^\circ acima da horizontal
    • Componente vertical:
      v_{y1} = v \cdot \operatorname{sen}(30^\circ) = 12{,}5 \times 0{,}5 = 6{,}25\text{ m/s}
  • Tempo de subida até a altura máxima (\Delta t_{\text{subida}}):

    \Delta t_{\text{subida}} = \frac{v_{y1}}{g} = \frac{6{,}25}{10} = 0{,}625\text{ s}

    Portanto, o vértice da parábola ocorre em:
    t_{\text{vértice}} = 0{,}5 + 0{,}625 = 1{,}125\text{ s}

  • Altura máxima alcançada:

    y_{\text{máx}} = 0{,}50 + \frac{v_{y1}^2}{2g} = 0{,}50 + \frac{6{,}25^2}{20} = 0{,}50 + 1{,}953 \approx 2{,}45\text{ m}

  • Instante em que a bola é pega pelo defensor a uma altura de 175\text{ cm} = 1{,}75\text{ m}:
    A equação da posição vertical para t \ge 0{,}5\text{ s} com \Delta t = t - 0{,}5 é:

    y(t) = 0{,}50 + 6{,}25\Delta t - 5\Delta t^2

    Igualando a y = 1{,}75\text{ m}:

    1{,}75 = 0{,}50 + 6{,}25\Delta t - 5\Delta t^2 \implies 5\Delta t^2 - 6{,}25\Delta t + 1{,}25 = 0

    Dividindo toda a equação por 1{,}25:

    4\Delta t^2 - 5\Delta t + 1 = 0 \implies (4\Delta t - 1)(\Delta t - 1) = 0

    • \Delta t = 0{,}25\text{ s} \implies passagem por 1{,}75\text{ m} em movimento ascendente.
    • \Delta t = 1{,}0\text{ s} \implies passagem por 1{,}75\text{ m} em movimento descendente.

    Como o defensor a pega em movimento descendente, a trajetória se encerra em:

    t_{\text{final}} = 0{,}5 + 1{,}0 = 1{,}5\text{ s}

    Nesse instante:

    • y(1{,}5) = 1{,}75\text{ m}
    • v_y(1{,}5) = v_{y1} - g\Delta t = 6{,}25 - 10(1{,}0) = -3{,}75\text{ m/s}

Conclusão sobre os gráficos:

  • O gráfico de y(t) deve:

    • Começar em y = 1{,}75\text{ m} em t = 0;
    • Atingir o mínimo local de y = 0{,}5\text{ m} em t = 0{,}5\text{ s};
    • Subir até o ponto máximo de \approx 2{,}45\text{ m} em t = 1{,}125\text{ s};
    • Finalizar em t = 1{,}5\text{ s} com y = 1{,}75\text{ m}.
  • O gráfico de v_y(t) deve:

    • Começar em 0\text{ m/s} em t = 0 e decrescer linearmente até -5\text{ m/s} em t = 0{,}5\text{ s};
    • Ter uma descontinuidade (salto) para +6{,}25\text{ m/s} em t = 0{,}5\text{ s};
    • Decrescer linearmente, cruzando o zero em t = 1{,}125\text{ s} e finalizar em t = 1{,}5\text{ s} no valor de -3{,}75\text{ m/s}.

Essas características correspondem perfeitamente à Alternativa E (em que o gráfico é truncado no instante t = 1{,}5\text{ s}, quando a bola é capturada).

Resposta: E