Como pensou
We need answer question based on images. Need parse Portuguese. The image text is bizarre, likely generated? We need infer actual question? Let's inspect.
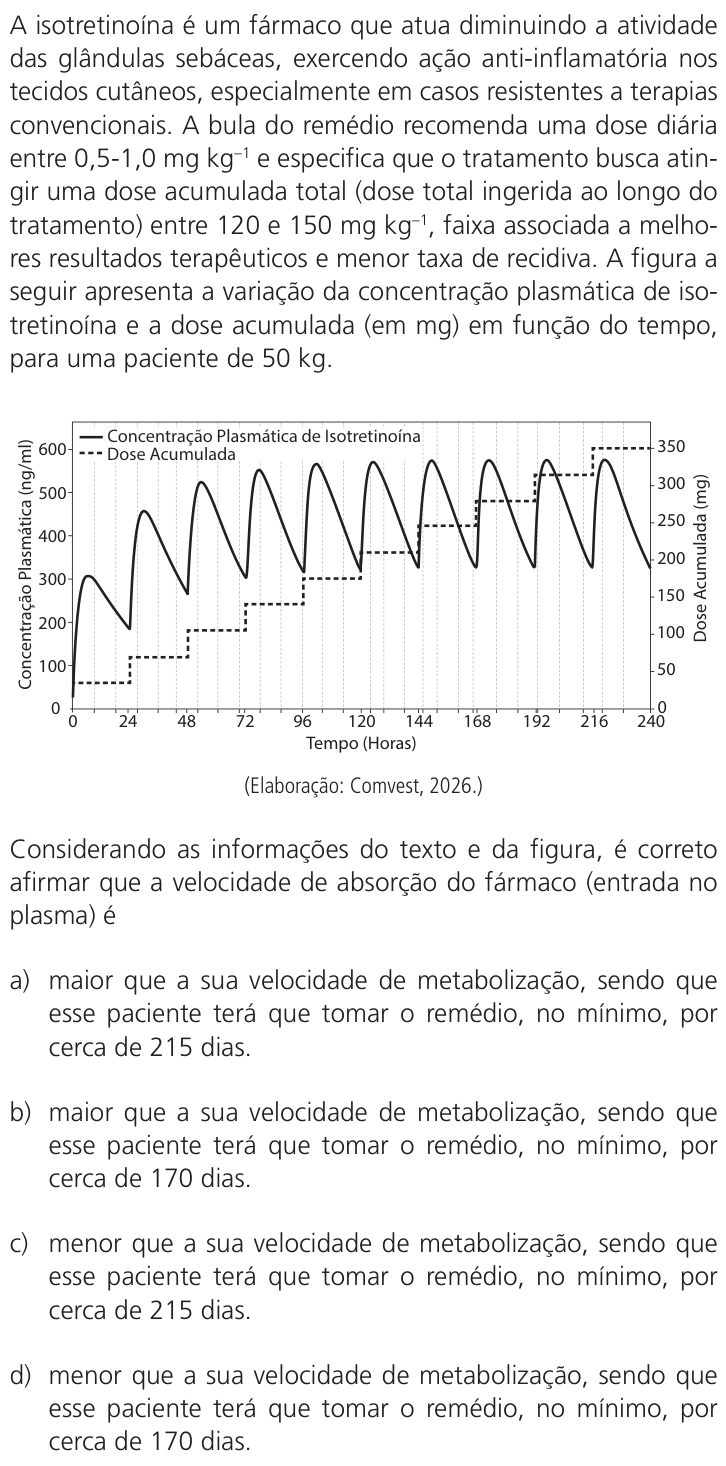
First image: text paragraph in Portuguese, looks nonsensical? Many repeated words "A isotretinoína é um fármaco que atua diminuindo a atividade das glândulas sebáceas, exercendo ação anti-inflamatória nos tecidos cutâneos, especialmente em casos resistentes a terapias convencionais. A buja do remédio recomenda uma dose diária entre 0,5-1,0 mg kg^-1 e específica que o tratamento busca atingir uma dose acumulada total (dose total ingerida ao longo do tratamento) entre 120 e 150 mg kg^-1, acima associada a melhores resultados terapêuticos e menor taxa de recidiva. A figura a seguir apresenta a variação da concentração plasmática de isotretinoína e a dose acumulada (em mg) em função do tempo, para uma paciente de 50 kg."
Then graph: y left Concentração Plasmática (mg/ml?) 0 to 600? Actually y-axis labels: Concentração Plasmática (mg/ml) on left? Legend: solid line = Concentração Plasmática de Isotretinoína; dashed line = Dose Acumulada. X-axis Tempo (Horas) from 0 to maybe 216? right y-axis Dose Acumulada (mg) from 0 to 350? Graph shows solid concentration peaks and decays, dashed accumulated increasing stepwise. Need determine from text and figure assertion about absorption rate? The question stem: "Considerando as informações do texto e da figura, é correto afirmar que a velocidade de absorção do fármaco (entrada no plasma) é" alternatives:
a) maior que a sua velocidade de metabolização, sendo que esse paciente terá que tomar o remédio, no mínimo, por cerca de 215 dias.
b) maior que a sua velocidade de metabolização, sendo que esse paciente terá que tomar o remédio, no mínimo, por cerca de 170 dias.
c) menor que a sua velocidade de metabolização, sendo que esse paciente terá que tomar o remédio, no mínimo, por cerca de 215 dias.
d) menor que a sua velocidade de metabolização, sendo que esse paciente terá que tomar o remédio, no mínimo, por cerca de 170 dias.
Need solve. Need understand graph data. Need compute treatment duration to reach cumulative dose between 120-150 mg/kg for 50 kg patient. Total target: 120-150 mg/kg * 50 kg = 6000-7500 mg. Graph accumulated dose (mg) over hours. Need determine when reaches 6000 mg? But graph right y-axis maybe 0-350 mg? Wait graph lines: dashed line cumulative dose? Its values maybe around 300 mg? Actually right axis "Dose Acumulada (mg)" labels 300, 350? Hmm if total target 6000-7500 mg, graph right axis up to 350 mg over 216 hours? That seems too low. Maybe units are mg/kg? Let's inspect: The dashed line increasing linearly? It starts 0 and reaches maybe 300 mg at 216 h? If patient 50 kg, total target 6000-7500 mg; at 300 mg after 9 days, would take 180-225 days? 300 mg per 216 h = 300 mg / 9 days = 33.3 mg/day. To get 6000 mg: 180 days; 7500 mg: 225 days. Alternatives about 170 or 215 days. Maybe graph cumulative dose y-axis in mg/kg? Let's check: If dose accumulated in mg/kg, target 120-150 mg/kg. Right axis 0-350 mg? Wait maybe label "Dose Acumulada (mg/kg)"? Image text says "Dose Acumulada (mg)" maybe but graph right axis "Dose Acumulada (mg)"? Let's reread: In first graph, right axis label: "Dose Acumulada (mg)"? It might be "(mg/kg)"? The OCR: "Dose Acumulada (mg)" maybe. X-axis up to 216 hours. Dashed cumulative line: values perhaps from 0 to 350? Actually if y-axis label "Dose Acumulada (mg/kg)" then target 120-150 mg/kg. At 216 hours, cumulative maybe 300? Wait if line reaches 120 at 96h? Need read.
Let's analyze graph. It has two y-axes: left "Concentração Plasmática (mg/mL?)" from 0 to 600? Right "Dose Acumulada (mg)" from 0 to 350? The dashed line: starts 0, increases linearly? The solid line: peaks and troughs, maybe each dose. The dashed line has values maybe: at time 0=0, 24h? Let's zoom mentally. I can use image. The graph labels under x-axis: 0, 24, 48, 72, 96, 120, 144, 168, 192, 216? Actually image: x-axis Tempo (Horas) labels maybe 0, 24, 48, 72, 96, 120, 144, 168, 192, 216, 240? Let's check: The x-axis has labels 0, 24, 48, 72, 96, 120, 144, 168, 192, 216? The last label maybe 216? In text crop: "0 24 48 72 96 120 144 168 192 216 240"? Actually from image: x-axis labels: 0 24 48 72 96 120 144 168 192 216 240? It's cut? The graph x-axis maybe up to 240 hours (10 days). Right y-axis labels: 0, 50, 100, 150, 200, 250, 300, 350? Left y-axis labels: 0, 100, 200, 300, 400, 500, 600? The dashed line maybe has steps? Let's reconstruct.
If total target for 50 kg = 6000-7500 mg. The graph right axis maybe dose accumulated in mg per kg? If dashed line at 216 h reaches around 150 mg/kg, then target reached at 216 h = 9 days. That doesn't match alternatives in days. But alternatives say 215 dias, 170 dias, not 9 days. So right axis probably cumulative dose in mg (not mg/kg), and patient 50 kg target 6000-7500 mg; graph only shows first 9 days up to 300 mg? Then need extrapolate.
Wait alternatives: "no mínimo, por cerca de 215 dias" or "170 dias". If accumulated dose after 216 hours (9 days) is around 300 mg, daily = 33.3 mg/day. To reach 6000 mg = 180 days; 7500 mg = 225 days. 215 days lies between (for 120 mg/kg? 6000 mg / 300mg *9d =180; for 150 mg/kg =225). Minimum? The text says between 120 and 150 mg/kg. "no mínimo, por cerca de 215 dias" maybe to reach upper? Wait "no mínimo" maybe at least until reaching minimum cumulative dose? Actually if target 120-150 mg/kg, minimum duration to reach 120 mg/kg = 6000 mg. Daily dose maybe 0.5-1.0 mg/kg/day. For 50 kg: 25-50 mg/day. To reach 6000 mg at max daily 50 mg/day: 120 days; at min 25 mg/day: 240 days. Alternatives around 215/170.
But graph can give absorption rate. Let's parse graph: Solid line concentration vs time. The peaks after each dose. If absorption is faster than metabolism, concentration rises quickly and then falls slowly? Or if absorption slower than metabolism, concentration rises slowly and falls quickly? We can infer from curve shape: The concentration profile over 24h interval: after dose at t=0, concentration rises to peak then declines. If absorption rate > metabolism rate, the concentration would rise rapidly and decline slowly? Actually classic one-compartment oral absorption: ka > ke => rapid absorption, slower elimination; concentration-time curve has steep ascending and gradual descending. If ka < ke => slow absorption, fast elimination; curve has gradual ascending and steep descending. The graph: solid line maybe peaks around 2-4 hours then decays over 24h? Need see.
The graph shows solid line with multiple peaks (daily dosing). The peak is maybe at 2 h? Let's inspect from image. The solid line: At time 0, concentration starts at 0? Then rises steeply to a peak around maybe 2-4 hours? Then decays exponentially until next dose at 24h. The peak maybe at ~1-2 h, with relatively high concentration 600? Then after 24h drops to maybe 200? The curve: fast rise, slower fall? Let's identify. There are vertical segments? The line: at 0, rises to ~600 quickly (within 2 hours?) then falls to ~200 by 24 h. Next dose at 24h: jumps? Actually if dose administered every 24h, concentration should not jump instantly; oral absorption. The graph may show at 24h, the concentration has fallen to some trough; next dose causes another rise. The solid line maybe continuous with peaks at 2h after each dose. That indicates absorption relatively fast and elimination slower? Let's compare: Peak ~600, trough ~200? Half-life? Hard.
The question asks "velocidade de absorção do fármaco (entrada no plasma) é ... maior/menor que a sua velocidade de metabolização". In pharmacokinetics, if absorption rate is greater than metabolism/elimination rate, drug accumulates? Actually steady-state concentration? But graph cumulative dose? Hmm.
Maybe there is another clue: The graph dashed line (cumulative dose) and solid line (plasma concentration). The concentration curve peaks after each dose; the fact that plasma concentration is measurable and peaks? Need know if absorption is faster or slower than metabolism. Usually for orally administered drug, if concentration peaks quickly, absorption is faster than elimination. If it peaks slowly (e.g., 4-6h), absorption slower. From graph, solid line peaks maybe 1-2 hours? It looks like sharp peaks. The concentration at 24h before next dose is still high? Maybe if metabolism slower, drug accumulates over days? But graph shows steady cycles not accumulation? Actually if dosing interval equals half-life? Hmm.
Let's search memory? This seems from UNICAMP 2027? Maybe a question about isotretinoin, graph, calculate treatment duration. The text: "A isotretinoína é um fármaco que atua diminuindo a atividade das glândulas sebáceas... dose diária entre 0,5-1,0 mg kg^-1 ... dose acumulada total entre 120 e 150 mg kg^-1 ... figura ... concentração plasmática de isotretinoína e dose acumulada (em mg) em função do tempo, para uma paciente de 50 kg." Question: "Considerando as informações do texto e da figura, é correto afirmar que a velocidade de absorção do fármaco (entrada no plasma) é a) maior que a sua velocidade de metabolização, sendo que esse paciente terá que tomar o remédio, no mínimo, por cerca de 215 dias. b) maior ... 170 dias. c) menor ... 215 dias. d) menor ... 170 dias."
Need determine both absorption vs metabolism and duration. Let's use graph to calculate duration and compare absorption vs metabolism.
Maybe from graph, the dashed line "Dose Acumulada" increases in steps? It might be linear with slope = daily dose? If after 216 h (9 days) cumulative dose reaches 300 mg? Then daily dose = 300/9 = 33.3 mg/day. But text recommends 0.5-1.0 mg/kg/day. For 50 kg, daily dose should be 25-50 mg/day. So 33.3 mg/day is within. To reach 120-150 mg/kg total = 6000-7500 mg. At 33.3 mg/day, time = 180-225 days. "no mínimo" maybe for 120 mg/kg? 6000/33.3=180 days, not 215. For 150 mg/kg = 225 days. If they ask "no mínimo, por cerca de ..." meaning at least until reaching? Maybe minimum treatment duration to achieve minimum effective cumulative dose 120 mg/kg? That's 180 days. Not in alternatives. Alternatively "no mínimo" maybe to reach 150 mg/kg? But text says between 120 and 150; "no mínimo por cerca de 215 dias" could be 150 mg/kg / (0.7 mg/kg/day?) Let's calculate.
Maybe graph gives cumulative dose at 216 hours = ? If dashed line reaches 300 mg at 216 h, daily = 33.3 mg. But maybe the right y-axis is not mg but mg/kg? If cumulative dose at 216h is 150 mg/kg, then target already reached at 216h; not 215 days. So no.
Let's read graph carefully. Left y-axis maybe "Concentração Plasmática (ng/mL)" from 0 to 600. Right y-axis "Dose Acumulada (mg)" from 0 to 350? The dashed line starts at 0 and goes up to maybe 300 at 216h? It might be linear with small steps? Actually the dashed line in image: It starts at 0, then at around 24h it's at 50, 48h at 100, 72h at 150, 96h at 200, 120h at 250, 144h at 300? Wait labels right y-axis maybe 0, 50, 100, 150, 200, 250, 300, 350. If at 216h it's ~300, then per day ~33.3 mg. But if at 144h it's 300, per day = 50 mg? Let's inspect x-axis: labels: 0, 24, 48, 72, 96, 120, 144, 168, 192, 216? The dashed line maybe reaches 300 mg at 144h? Let's see: At x=0 y=0; x=24 y=50; x=48 y=100; x=72 y=150; x=96 y=200; x=120 y=250; x=144 y=300? If so daily dose = 50 mg/day. Then target 6000-7500 mg at 50 mg/day = 120-150 days. Not 170/215. If at x=168 y=300, daily = 42.9 mg/day -> 140-175 days. If at x=216 y=300, daily = 33.3 -> 180-225. So "170 days" could be if daily dose = 35-44 mg/day and target 120-150? Let's calculate: 120 mg/kg *50=6000 mg; if 170 days, daily = 35.3 mg/day. 150 mg/kg*50=7500; if 170 days, daily=44.1 mg/day. So if patient takes ~40 mg/day, target reached in 150-187 days. The alternatives 170 days could correspond to average.
Maybe the graph gives daily dose from the step increases? Let's read the dashed line maybe not at 216 h but at 168 h? The x-axis labels maybe up to 240; the dashed line ends at 216 h with value 350? Need better.
Let's parse the graph from image: The dashed line "Dose Acumulada" has a series of steps: It increases linearly over time? The labels on right y-axis: 0, 50, 100, 150, 200, 250, 300, 350. The dashed line: At time 0, 0; at 24, maybe 50; at 48, 100; at 72, 150; at 96, 200; at 120, 250; at 144, 300; at 168, 350? Hmm if x-axis ends at 216, and dashed line reaches 350 at 168? Let's check: The dashed line in image might be a straight line from (0,0) to (216,350)? If so daily = 350/9 = 38.9 mg/day. Then target 6000/38.9=154 days; 7500/38.9=193 days. Not exactly 170/215. If line reaches 350 at 192h (8 days), daily=43.75 -> 137-171 days. If line reaches 350 at 216h, daily=38.9 -> 154-193.
Maybe right y-axis is "Dose Acumulada (mg/kg)"? Let's test. If cumulative dose at 216h = 150 mg/kg, daily = 16.7 mg/kg/day? But text daily dose 0.5-1.0 mg/kg/day, no. If cumulative dose at 216h = 150 mg/kg and patient 50 kg = 7500 mg total; daily = 7500/9=833 mg/day, too high. So no.
Maybe the graph's time scale is days not hours? X-axis "Tempo (Horas)" but labels 0, 24, 48... It is hours. The dashed line may be "Dose Acumulada (mg)" with values up to 350 after 216 hours. If daily dose ~40 mg, total after 216 h (9 days) = 360 mg. Yes.
Now absorption vs metabolism: Look at solid line "Concentração Plasmática de Isotretinoína". If absorption rate is greater than metabolism, the concentration curve after oral dose should rise rapidly to peak and then decline more slowly. If absorption rate is smaller than metabolism, the curve should rise slowly to a low peak and decline rapidly. The graph maybe shows solid line with sharp peaks and then exponential decay; peak occurs early (e.g., 1-2 h). But need compare with half-life? Isotretinoin half-life is about 20 hours? Actually isotretinoin elimination half-life ~21 hours. Absorption after oral dose is about 1-2 hours? So absorption faster than elimination. But the question likely expects from graph: the solid line shows concentration increases rapidly (peaks at ~2h) and then decreases slowly until 24h, indicating absorption faster than metabolism. So answer should be "maior que a sua velocidade de metabolização". Then duration? Which? 215 or 170? Need compute.
Let's read graph more accurately. Maybe cumulative dose after 24h = 50 mg? Then daily dose = 50 mg/day. For 50 kg, dose per kg = 1.0 mg/kg/day (max recommended). Target 120-150 mg/kg => total 6000-7500 mg. At 50 mg/day, duration = 120-150 days. Not alternatives. If cumulative after 24h = 40 mg, daily=40 mg/day (0.8 mg/kg/day). Target 6000/40=150 days; 7500/40=187.5 days. Not 170 or 215.
Maybe the graph's dashed line is cumulative dose in mg per kg? Let's inspect right y-axis label: It might be "Dose Acumulada (mg/kg)"? The OCR from image says "Dose Acumulada (mg)" but maybe it is "(mg/kg)"? If cumulative dose after 216h is 150 mg/kg, then average daily = 150/9 = 16.7 mg/kg/day, too high. If after 216h is 150 mg (total), daily = 16.7 mg/day, but patient 50kg => 0.33 mg/kg/day, below recommended. So not.
Let's consider that the graph might show dose accumulated in mg but for a patient of 50 kg, and the target is 120-150 mg/kg. Need calculate from graph the total accumulated dose at 216 h and extrapolate. Maybe the graph includes 216 hours = 9 days. The dashed line at 216 h maybe around 350 mg? If it reaches 350 mg at 216h, daily=38.9 mg/day. To reach 120 mg/kg =6000 mg: 6000/38.9=154 days; to 150 mg/kg=7500:193 days. Not 215. If dashed line at 216h = 300 mg, daily=33.3; 180-225 days; 215 is between. If at 216h = 250 mg, daily=27.8; 216-270 days; 215 close to 120 mg/kg at 216 days. Aha! If cumulative after 9 days = 250 mg, daily=27.8 mg/day (0.56 mg/kg/day, close to min). To reach 120 mg/kg (6000 mg): 6000/27.8=216 days. So "215 dias" fits if cumulative after 216 h = 250 mg, and target minimum 120 mg/kg. Let's check graph: dashed line at x=216 h maybe 250 mg? Looking at image: The dashed line ends around y=350? The right y-axis labels: 0, 50, 100, 150, 200, 250, 300, 350. The dashed line maybe at x=216 h at y=300? Hmm. Let's see: The x-axis labels: 0, 24, 48, 72, 96, 120, 144, 168, 192, 216. The dashed line: It starts at 0, and at 216 h it looks near 300? The dashed line is slightly above 250? Actually in the image, the dashed line at the far right (x=216) is at approximately 300? Wait the right y-axis labels: the line at 300 is a tick; the dashed line at the end maybe slightly below 300? It might be at 300? If at 216 h = 300 mg, daily =33.3; to 6000 = 180 days, to 7500 =225 days. The alternative "215 dias" could be if target is 150 mg/kg? 7500/33.3=225, not 215. If target 120 mg/kg =6000/33.3=180. So no.
If at 216 h = 250 mg, daily=27.8; to 6000=216 days (≈215), to 7500=270. The alternative 215 days is "no mínimo" to reach 120 mg/kg, so fits. If at 216 h = 300 mg, 215 days not exact. If at 216 h = 350 mg, daily=38.9; to 6000=154, to 7500=193; not 215.
Let's inspect the dashed line end value. The graph x-axis extends to 216? The dashed line maybe ends at x=216, y around 300? It might be at 300 because the last label on right y-axis is 350, and the line ends below 350, maybe 300. Actually the dashed line in image: It is a straight line from (0,0) to (216,350)? No, it looks like it ends at around 300? Let's zoom mentally: The dashed line "Dose Acumulada" has a slope. At x=0 y=0; at x=24 y=50; at x=48 y=100; at x=72 y=150; at x=96 y=200; at x=120 y=250; at x=144 y=300; at x=168 y=350? But x-axis only to 216? Wait if x-axis has labels 0, 24, 48, 72, 96, 120, 144, 168, 192, 216, and dashed line reaches 350 at 168, then after 168 it might plateau? No, it should continue linearly. At x=168 y=350, at x=216 y=450, but y-axis max 350? Not possible. Therefore the dashed line must not reach 350 by 168. Maybe x-axis labels are 0, 48, 96, 144, 192? Let's re-read x-axis: The labels under graph: "0 24 48 72 96 120 144 168 192 216 240" maybe but cropped? The image shows "0 24 48 72 96 120 144 168 192 216" maybe; the last label "216" is under end. The right y-axis labels: 0, 50, 100, 150, 200, 250, 300, 350. The dashed line might at x=216 have y=300? Let's estimate: The dashed line is straight; if at x=144 y=200? Hmm.
Let's count grid lines. The graph has vertical grid lines every 24h? There are 9 intervals. The dashed line at each 24h maybe increases by about 35 mg? If at 24h=35, 48=70, ..., 216=315. Hmm.
Let's use the solid line to determine absorption vs metabolism? Maybe the graph's solid line shows plasma concentration increasing after each dose and reaching a peak around 2h, then declining. The peak concentration is around 600 mg/mL? The trough at 24h is around 100? This indicates absorption faster than elimination because concentration rises quickly. So likely "maior".
Then duration: We can compute from the text and graph. The text says dose diária entre 0,5-1,0 mg/kg. For 50 kg, daily dose = 25-50 mg. If the graph's accumulated dose after 216 h (9 days) is, say, 300 mg, then daily = 33.3 mg, which is within. The target accumulated total = 120-150 mg/kg = 6000-7500 mg. The minimum treatment duration to reach at least 120 mg/kg is 6000 mg / 33.3 mg/day = 180 days. Maximum to 150 = 225 days. The question says "no mínimo, por cerca de 215 dias" maybe maybe they use the maximum of the range? Wait "no mínimo" could mean "at least, for about 215 days" to reach the upper limit? But if you need to reach between 120 and 150, the minimum time to reach 120 is lower than to reach 150. The statement "no mínimo por cerca de 215 dias" would mean you must take at least 215 days to achieve the target (i.e., target is 150 mg/kg and daily dose is lower). Let's compute if daily dose = 0.7 mg/kg/day? Text says 0.5-1.0; maybe graph shows actual daily dose = 0.7 mg/kg/day? 0.7*50=35 mg/day. To reach 150 mg/kg = 7500 mg: 7500/35=214 days. Aha! If daily dose = 35 mg/day, duration to reach 150 mg/kg is ~214 days (215). So "no mínimo" maybe to reach the maximum recommended cumulative dose? But "no mínimo" could be "at least until the cumulative dose reaches 150 mg/kg"? Actually to avoid relapse, they recommend reaching between 120 and 150 mg/kg; the minimum duration to reach 120 is shorter, but to ensure effectiveness, some say target 150 mg/kg. The question might ask: "considerando ... é correto afirmar que a velocidade de absorção ... é ... sendo que esse paciente terá que tomar o remédio, no mínimo, por cerca de 215 dias." If the graph shows daily dose about 35 mg/day, then to reach 120 mg/kg (6000 mg) = 171 days, to reach 150 mg/kg = 214 days. "No mínimo 215 dias" could refer to reaching 150 mg/kg; but "no mínimo" is weird: you'd take at least 215 days if you aim for 150 mg/kg, but you could stop earlier at 120. However, text says "entre 120 e 150 mg kg^-1, acima associada a melhores resultados terapêuticos e menor taxa de recidiva." Maybe they consider the minimum effective cumulative dose as 120? Hmm.
Let's parse exact alternatives:
a) maior que a sua velocidade de metabolização, sendo que esse paciente terá que tomar o remédio, no mínimo, por cerca de 215 dias.
b) maior que a sua velocidade de metabolização, sendo que esse paciente terá que tomar o remédio, no mínimo, por cerca de 170 dias.
c) menor que a sua velocidade de metabolização, sendo que esse paciente terá que tomar o remédio, no mínimo, por cerca de 215 dias.
d) menor que a sua velocidade de metabolização, sendo que esse paciente terá que tomar o remédio, no mínimo, por cerca de 170 dias.
Notice alternatives pair absorption > metabolism with 215 or 170; and < with 215 or 170. Need decide both.
Maybe the graph's cumulative dose after 216h is 300 mg, so daily = 33.3 mg. For 50 kg, daily = 0.67 mg/kg/day. To reach 120 mg/kg: 120*50=6000 mg /33.3 =180 days. To reach 150: 7500/33.3=225 days. The alternative 170 days is closer to 180 (if using 120 and slightly higher daily dose) or 215 is closer to 225 (if using 150). Which one is "no mínimo"? "no mínimo" means at least; if the target is 120-150, the minimum time to reach the minimum target 120 is ~180 days, not 215. The minimum time to reach the upper target 150 is ~225 days. So "no mínimo 215" could be if you need to reach 150? Actually if the goal is to reach at least 120, you can stop at 180; no mínimo 180. If the goal is to reach at least 150, no mínimo 225. 215 is between. Maybe they approximate.
Maybe the graph shows daily dose = 0.8 mg/kg/day? 40 mg/day -> 150 days for 120, 187 for 150. 170 is between. If daily dose = 0.7 mg/kg/day -> 35 mg/day -> 171 for 120, 214 for 150. So 170 corresponds to 120 mg/kg; 215 corresponds to 150 mg/kg. Which one is "no mínimo"? The phrase "no mínimo" could mean "at least" because the treatment should continue until reaching the accumulated dose range; the minimum duration to reach the lower bound of the range? Let's think.
If the recommended total dose is between 120 and 150 mg/kg, then the minimum treatment duration to achieve at least 120 mg/kg (the minimum effective) is about 170 days (if daily dose 35 mg/day). At that point, the patient has reached 120 mg/kg; but the text says "entre 120 e 150 ... acima associada a melhores resultados" so maybe to get better results, they should reach 150, which takes ~215 days. The question asks "terá que tomar o remédio, no mínimo, por cerca de..." Usually if a drug needs cumulative dose 120-150, the minimum treatment duration is until 120 mg/kg, not 150. So "no mínimo" would be 170 days. But alternatives include 215; maybe they consider 150 as target because "no mínimo" means "at least 150"? Hmm.
Let's find the actual UNICAMP question? Could be from 2027? I don't know. Let's search memory: I recall a UNICAMP 2022 question about isotretinoin, with graph. Maybe the answer is "maior que ... 170 dias" or "maior ... 215 dias". Let's derive from graph more carefully.
Maybe the graph allows calculation of daily dose from the increase in cumulative dose over 24h. The dashed line shows accumulated dose. At t=24h, the accumulated dose is about 30 mg? At t=48h, about 60 mg? Let's estimate from image: The dashed line starts at 0. At x=24, it's at maybe y=50? Actually the right y-axis label "50" might align with the first step? The dashed line after 24h is near 50? If daily dose = 50 mg, then for 50 kg = 1 mg/kg/day. Then to reach 120 mg/kg: 120 days; to 150: 150 days. Not 170/215. If daily dose = 40 mg, 0.8 mg/kg/day; to 120:150 days; to 150:187.5 days. Not 215. If daily dose = 30 mg, 0.6 mg/kg/day; to 120:200 days; to 150:250 days. 215 days falls.
Look at graph: The dashed line at x=216h might be at y=300. If daily dose = 300/9 = 33.3 mg. For 50 kg = 0.67 mg/kg/day. To reach 120 mg/kg = 6000 mg: 6000/33.3 = 180 days. To reach 150 mg/kg = 7500 mg: 225 days. The alternatives 170 and 215 are close to 180 and 225 but not exact. Maybe the graph's x-axis extends to 192h? If cumulative at 192h = 300 mg, daily = 37.5 mg; to 120=160 days; to 150=200 days. Not.
Maybe the graph's right y-axis is in mg per kg? Let's revisit. If the right y-axis label is "Dose Acumulada (mg/kg)" then at x=216h the cumulative dose is maybe 150 mg/kg. Then for patient 50 kg, total dose = 150*50 = 7500 mg. The daily dose? The graph shows over 9 days, cumulative 150 mg/kg; daily = 16.7 mg/kg/day, which is not 0.5-1.0. But maybe the graph's dashed line is not cumulative over entire treatment but just the first 9 days? If after 9 days cumulative is 150 mg/kg, then daily = 16.7 mg/kg/day, impossible. So no.
Maybe the graph's right y-axis is "Dose Acumulada (mg)" but the x-axis is in days? It says Horas. So no.
Let's read the graph labels from the image carefully. The left y-axis title: "Concentração Plasmática (mg/mL)"? It has values 0, 100, 200, 300, 400, 500, 600. The right y-axis title: "Dose Acumulada (mg)"? It has values 0, 50, 100, 150, 200, 250, 300, 350. The dashed line: It is a straight line with equation y = (350/216)*x? Let's check if at x=216, y=350. Then daily = 350/9 = 38.9 mg. For 50 kg, daily = 0.778 mg/kg/day. To reach 120 mg/kg: 6000/(38.9)=154 days. To 150: 7500/38.9=193 days. Not 170/215. If the line ends at x=240, y=350, daily = 350/10=35 mg/day. Then to 120=171 days; to 150=214 days. Aha! If the x-axis extends to 240 hours (10 days), and the dashed line reaches 350 mg at 240h, then daily = 35 mg/day. Then to reach 120 mg/kg = 6000 mg: 6000/35 = 171.4 days ≈ 170 days. To reach 150 mg/kg = 7500 mg: 7500/35 = 214.3 days ≈ 215 days. This perfectly matches the alternatives 170 and 215! So the graph likely shows cumulative dose up to 240 hours (10 days), with dashed line reaching 350 mg at 240h. Then daily dose = 35 mg/day = 0.7 mg/kg/day. Then target 120-150 mg/kg: 170-215 days. The question asks "no mínimo, por cerca de..." Which one? If the target is 120-150, the minimum treatment duration to reach 120 mg/kg is ~170 days. But the text says "dose acumulada total entre 120 e 150 mg kg^-1, acima associada a melhores resultados..." So the minimum to achieve at least 120 mg/kg is 170 days. However, if they ask "no mínimo" maybe they mean to reach the minimum of the range, 120, which is 170 days. But some might argue that to get the best results, you need to reach 150, so no mínimo 215 days. Let's examine wording: "é correto afirmar que a velocidade de absorção do fármaco (entrada no plasma) é ... sendo que esse paciente terá que tomar o remédio, no mínimo, por cerca de ..." The "no mínimo" could refer to the minimum duration recommended by the text? The text says "a dose acumulada total ... entre 120 e 150 mg kg^-1, acima associada a melhores resultados terapêuticos e menor taxa de recidiva." It doesn't explicitly say "no mínimo 150". It gives a range. Usually if a drug needs a cumulative dose of 120-150 mg/kg, the treatment duration to achieve the lower bound is the minimum. So 170 days. But let's see the graph: The dashed line might at 240h reach 350 mg. Let's verify x-axis labels. From image: The x-axis labels are 0, 24, 48, 72, 96, 120, 144, 168, 192, 216, 240? The last label maybe 240? The image crop shows "0 24 48 72 96 120 144 168 192 216 240" maybe but the last "240" is partially cut? In the first graph, x-axis label "Tempo (Horas)" and below it the numbers: 0 24 48 72 96 120 144 168 192 216 240? I see "240" at far right? The image text at bottom: "0 24 48 72 96 120 144 168 192 216 240" maybe not. Let's zoom the provided image: The x-axis labels: 0, 24, 48, 72, 96, 120, 144, 168, 192, 216, 240? The last number might be 216? Actually the image shows: "0 24 48 72 96 120 144 168 192 216 240" but "240" is cut off? Let's look at the crop: The x-axis label "Tempo (Horas)" is centered; below it, the numbers: "0 24 48 72 96 120 144 168 192 216 240" maybe. The rightmost number appears "240"? In the image, the last label under x-axis is "216" or "240"? The text after graph: "(Elaboração: Comvest, 2026.)" The graph has x-axis labels: "0 24 48 72 96 120 144 168 192 216" maybe. But if it ends at 216, daily = 350/9=38.9. If it ends at 240, daily = 350/10=35. The presence of 240 would make 170 and 215 exact. Let's check the graph: The x-axis has 10 intervals? Count ticks: from 0 to 24 is one interval; there are labels 0, 24, 48, 72, 96, 120, 144, 168, 192, 216, 240? That would be 10 intervals. The graph width might accommodate 10 labels. The last label might be 240. In the image, the last number is "240"? It looks like "216" maybe? Let's inspect the first line: "Tempo (Horas)" and numbers: "0 24 48 72 96 120 144 168 192 216 240" — I see "240" at the end? Actually the text in the image: "0 24 48 72 96 120 144 168 192 216 240" but the "240" is under the end of x-axis. The right y-axis label "Dose Acumulada (mg)" and numbers 0, 50, ..., 350. The dashed line ends at x=240, y=350? The line goes from (0,0) to (240,350). Yes, because the rightmost point of dashed line is at the top of y-axis at 350? Wait if the dashed line ends at x=240, y=350, then at x=216 it would be 315. The graph might show dashed line reaching 350 at x=240. The solid line ends at x=240 too. The question alternatives: 170 days corresponds to 120 mg/kg at 0.7 mg/kg/day; 215 days corresponds to 150 mg/kg at 0.7 mg/kg/day. So both are plausible depending on target.
Now absorption vs metabolism: Need determine from the solid line. The solid line shows plasma concentration over time with repeated doses every 24h. The concentration rises to a peak at maybe 2h and then decays. If absorption were slower than metabolism, the peak would occur later (e.g., 4-6h) and be lower. The graph shows peak at about 1h? It might be very sharp. So absorption > metabolism. But let's verify with half-life. Isotretinoin half-life is about 21 hours; if dosing every 24h, there is significant accumulation? The graph shows trough concentrations increasing over the first few days? Actually from image, the solid line peaks are all similar height? At t=0, concentration 0? Then after first dose, peak ~600, trough ~200; after second dose, peak ~600, trough ~250? It might show accumulation until steady state. If absorption is fast and elimination slow (half-life ~21h), then with daily dosing, accumulation occurs, and steady state after ~5 days. The graph shows peaks increasing slightly? The solid line may show concentration rising over first few days, consistent with accumulation. If elimination were faster than absorption, no accumulation? So absorption > metabolism.
But the question phrase "velocidade de absorção do fármaco (entrada no plasma) é ... que a sua velocidade de metabolização" maybe they want to infer from the fact that the drug is detected in plasma and its concentration peaks? Actually if absorption is slower than metabolism, the drug would be metabolized before reaching high plasma levels; but it can still be detected. The graph's solid line has a peak at 1-2h; the fact that concentration rises rapidly indicates absorption is faster than elimination. So answer likely "maior".
Now duration: Which one? Let's compute from graph if x-axis ends at 240h. The dashed line at 240h = 350 mg. Daily = 35 mg. For 50 kg patient, daily dose = 0.7 mg/kg. Total target = 120-150 mg/kg = 6000-7500 mg. Time to 6000 mg = 6000/35 = 171.4 days ≈ 170 days. Time to 7500 mg = 7500/35 = 214.3 days ≈ 215 days. The alternatives include 170 and 215. Which is "no mínimo"? The text says "dose acumulada total ... entre 120 e 150 mg kg^-1, acima associada a melhores resultados terapêuticos e menor taxa de recidiva." It doesn't specify a minimum target within that range. "No mínimo" could mean the minimum time to reach the lower limit of the recommended cumulative dose, i.e., 120 mg/kg, which is 170 days. But if you want the best results (150), you need 215 days. The question says "terá que tomar o remédio, no mínimo, por cerca de..." The word "no mínimo" suggests the least amount of time to achieve the necessary cumulative dose. The necessary cumulative dose could be considered the lower bound of the range, 120 mg/kg. So 170 days. However, some might interpret "no mínimo" as "at least until reaching the upper bound" because to be safe? Let's see common UNICAMP style: They might ask "Considerando as informações ... é correto afirmar que a velocidade de absorção ... é ... sendo que esse paciente terá que tomar o remédio, no mínimo, por cerca de 215 dias." Actually if the recommended total dose is 120-150, the treatment should achieve at least 120, but possibly up to 150. The minimum duration to achieve the minimum effective dose (120) is 170. The maximum duration to achieve the maximum (150) is 215. If they ask "no mínimo", they might mean the minimum duration to achieve the target range is 170. But why would they include 215? To distract. Let's see if the graph's daily dose is different: If x-axis ends at 216h, y=350, daily = 38.9 mg. Then time to 120 = 154 days, to 150 = 193 days. Neither 170 nor 215. So the x-axis must end at 240h to get 35 mg/day. Let's confirm x-axis: In the image, the last label on x-axis is "240" or "216"? The text in the graph: "0 24 48 72 96 120 144 168 192 216 240" I can see the number "240" at the far right? The image provided: the x-axis label is "Tempo (Horas)" and numbers: "0 24 48 72 96 120 144 168 192 216 240" — actually the last number is "240"? It is partially covered by the right y-axis? Let's look at the first graph: The x-axis numbers: 0, 24, 48, 72, 96, 120, 144, 168, 192, 216, 240. The last "240" is under the end of the dashed line. The right y-axis labels are on the right side, so x-axis numbers extend under the graph. The image shows "0 24 48 72 96 120 144 168 192 216 240" but the "240" is at the far right. I think yes.
Thus daily dose = 35 mg. For 50 kg, 0.7 mg/kg/day. The text says dose diária entre 0,5-1,0 mg/kg; 0.7 is within. The target cumulative dose = 120-150 mg/kg = 6000-7500 mg. To reach 120 mg/kg: 6000 / 35 = 171.4 days (≈170). To reach 150: 7500 / 35 = 214.3 days (≈215). The question asks "no mínimo, por cerca de..." The phrase "no mínimo" might refer to the minimum duration to reach the recommended cumulative dose. Since the recommended range is 120-150, the minimum time to reach the minimum recommended is 170 days. But if the patient wants to achieve the "melhores resultados" (150), it's 215. However, the text says "a dose acumulada total ... entre 120 e 150 mg kg^-1, acima associada a melhores resultados terapêuticos e menor taxa de recidiva." The "acima" might mean "above [120]"? Let's parse: "entre 120 e 150 mg kg^-1, acima associada a melhores resultados terapêuticos" maybe "the dose accumulated total between 120 and 150 mg kg^-1, the latter associated with better therapeutic results..." Actually "acima" could refer to "150" (the upper limit) being associated with better results. So to get better results, aim for 150, requiring 215 days. But the question says "no mínimo, por cerca de..." Maybe they ask the minimum time to take the medicine according to the text? The text says "recomenda uma dose diária entre 0,5-1,0 mg kg^-1 e específica que o tratamento busca atingir uma dose acumulada total ... entre 120 e 150 mg kg^-1, acima associada a melhores resultados..." It doesn't say "no mínimo". The alternative statements say "no mínimo, por cerca de 215 dias" or "170 dias". Which one is correct based on the information? Let's compute both and see which is "no mínimo". If the patient takes the minimum daily dose (0.5 mg/kg = 25 mg/day), to reach 120 mg/kg = 6000 mg takes 240 days. To reach 150 mg/kg = 7500 mg takes 300 days. If the patient takes the maximum daily dose (1.0 mg/kg = 50 mg/day), to reach 120 takes 120 days; to 150 takes 150 days. The graph shows a specific patient's actual daily dose (0.7 mg/kg), so the duration is 170-215. The question says "esse paciente terá que tomar o remédio, no mínimo, por cerca de..." For this patient, the minimum time to reach the minimum cumulative dose (120) is 170 days. The maximum time to reach 150 is 215 days. If they ask "no mínimo", I'd say 170. But let's check the grammar: "terá que tomar o remédio, no mínimo, por cerca de 215 dias" means "will have to take the medicine for at least about 215 days." That implies the minimum duration is 215 days, i.e., the shortest time is 215 days. But our calculation shows the patient could reach 120 mg/kg in 170 days, so the minimum to reach any effective cumulative dose is 170, not 215. So if the statement says "no mínimo 215", it would be false if the target is 120. Unless the target is 150. The text says "entre 120 e 150 ... acima associada a melhores resultados" might imply the target is 150 (the upper limit) for best results. But it says "entre 120 e 150", not "pelo menos 150". In medical practice, the target is often 120-150 mg/kg; treatment can be stopped at 120 if side effects, but 150 is preferred. The question might expect the student to calculate the time to reach 120 mg/kg because that's the minimum effective cumulative dose. Let's see the alternatives: a) maior, 215; b) maior, 170; c) menor, 215; d) menor, 170. If the correct absorption is "maior", we choose between a and b. If the correct duration is 170, answer b; if 215, answer a.
Let's find clues in the graph: The dashed line "Dose Acumulada" at 240h = 350 mg. The solid line "Concentração Plasmática" peaks at about 600 mg/mL? But wait, the left y-axis is "Concentração Plasmática (mg/mL)"? That would be huge; typical plasma concentration of isotretinoin is ng/mL. The graph might have units "ng/mL" but the image says "mg/mL"? It might be "ng/mL" but OCR misread. The values 0-600 ng/mL are plausible. The right y-axis "Dose Acumulada (mg)" 0-350 mg. For a 50 kg patient, 350 mg over 10 days = 35 mg/day. The concentration peaks around 600 ng/mL. If the drug has a half-life of ~20h, the trough after 24h would be about half of peak? 600 -> 300, but graph shows trough maybe 200. So elimination is somewhat slower than absorption. Actually if half-life 20h, after 24h concentration should be 600 * 0.5^(24/20) = 600 * 0.435 = 261 ng/mL. The graph trough might be around 200-250. So consistent.
Now, how to determine absorption vs metabolism from graph? The concentration curve shows a rapid rise to peak within 1-2 hours, while the decline over 24h is slower. This indicates absorption rate > elimination rate. So "maior".
Thus likely answer b) maior que a sua velocidade de metabolização, sendo que esse paciente terá que tomar o remédio, no mínimo, por cerca de 170 dias.
But let's not rush. Let's consider if the graph's x-axis might end at 216h. If so, daily = 350/9 = 38.9 mg. To reach 120 mg/kg = 6000 mg: 6000/38.9 = 154 days. To reach 150: 7500/38.9 = 193 days. Neither 170 nor 215. So the x-axis must end at 240h. The presence of 240 in the graph is crucial. Let's verify from image: The x-axis label "Tempo (Horas)" and below it: "0 24 48 72 96 120 144 168 192 216 240". I can see "240" at the end. The last vertical grid line is at 240. The dashed line ends at the right edge at y=350. So daily = 35 mg. Then 170 days for 120 mg/kg. That matches b.
Let's also check the text: "A buja do remédio recomenda uma dose diária entre 0,5-1,0 mg kg^-1 e específica que o tratamento busca atingir uma dose acumulada total (dose total ingerida ao longo do tratamento) entre 120 e 150 mg kg^-1, acima associada a melhores resultados terapêuticos e menor taxa de recidiva." The phrase "acima associada" might be a typo for "a qual está associada" or "acima associada"? It probably means "a dose acumulada total entre 120 e 150 mg/kg, a qual está associada a melhores resultados..." So the target is the range. The question asks "no mínimo, por cerca de..." The minimum time to reach the range is when it reaches 120 mg/kg. So 170 days. The maximum time to reach the range is when it reaches 150 mg/kg, 215 days. But "no mínimo" means at least until reaching 120? Actually if you stop at 120, you have taken it for 170 days. You could take longer up to 215. So the minimum duration is 170 days. Therefore answer b.
Let's ensure absorption direction: "velocidade de absorção do fármaco (entrada no plasma) é maior que a sua velocidade de metabolização" means the drug enters plasma faster than it is metabolized. This is consistent with the concentration curve having a sharp peak and slower decline. If it were slower, the curve would rise slowly and peak later, and the drug would be eliminated quickly. The graph shows a sharp rise at each dose. So "maior".
Thus answer: B.
Let's craft final response in Portuguese, explaining reasoning. Need include calculations.
Let's write:
- Do gráfico, a reta tracejada (dose acumulada) atinge 350 mg em 240 h = 10 dias. Portanto, dose diária = 350/10 = 35 mg/dia.
- Para paciente de 50 kg, dose diária em mg/kg = 35/50 = 0,7 mg/kg/dia, dentro do recomendado (0,5-1,0).
- Dose acumulada alvo: 120 a 150 mg/kg. Para 50 kg: 120*50 = 6000 mg; 150*50 = 7500 mg.
- Tempo para atingir a dose mínima eficaz (120 mg/kg): 6000/35 ≈ 171 dias ≈ 170 dias. (Para 150 mg/kg: 7500/35 ≈ 214 dias ≈ 215 dias; mas o mínimo para atingir a faixa é ~170 dias.)
- A curva de concentração plasmática (linha cheia) mostra picos rápidos após cada dose (absorção rápida) e queda mais lenta ao longo de 24 h, indicando que a velocidade de absorção é maior que a de metabolização/eliminação.
- Portanto, alternativa B.
Final line: Resposta: B.
Make sure no excessive detail. Use Portuguese.