Correção IME 2027 · QuímicaAcompanhe a resolução de cada questão da 2ª fase, ao vivoAcompanhar
IA ao vivo / IME 2027 · 2ª fase · Química

COMPARE OS RACIOCÍNIOS

Questão 2 (Química)

Questão discursiva: a banca não divulga gabarito oficial. ← 1 (Química) 3 (Química) →

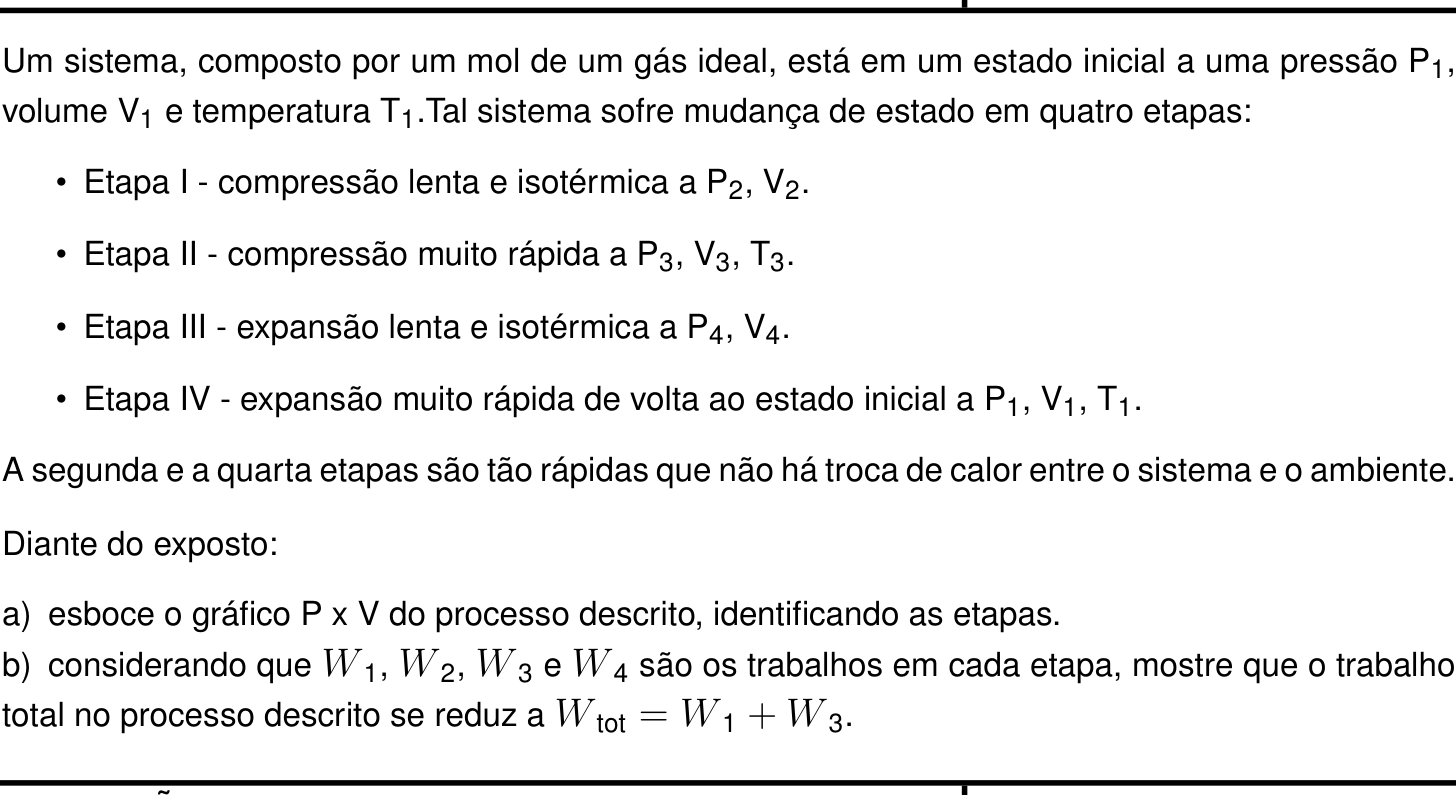
A questão

Texto de apoio da questão 2 (Química) Questão 2 (Química)

Resposta de referência

a) Ciclo horário no diagrama P\times V: I, compressão isotérmica 1\to2 a T_1; II, compressão adiabática 2\to3; III, expansão isotérmica 3\to4 a T_3>T_1; IV, expansão adiabática 4\to1. b) As variações de energia interna nas adiabáticas são opostas, portanto W_2+W_4=0 e W_{\mathrm{tot}}=W_1+W_3.

Segundo a resolução dos cursinhos Farias Brito e Poliedro. A banca não publica gabarito das questões discursivas.

Respostas das IAs

GPT-6 Astra

Respondeu · bate com a resposta de referência dos cursinhos

a) 1\xrightarrow{\text{isotérmica}}2\xrightarrow{\text{adiabática}}3\xrightarrow{\text{isotérmica}}4\xrightarrow{\text{adiabática}}1, conforme o esboço; b) W_{\mathrm{tot}}=W_1+W_3, pois W_2+W_4=0.

levou 32 s

Como pensou
**Considering diagram uniqueness** I’m thinking about whether the concept of irreversibility affects the uniqueness of diagrams. I wonder if I’m overcomplicating things for an exam setting. It might be essential to focus on the key aspects without overwhelming details. Let’s simplify things and concentrate on what is truly necessary to show clear, effective diagrams. Maybe I should break down the elements carefully and make sure everything is straightforward for better understanding.**Clarifying adiabatic diagrams** I need to consider whether to reference standard diagrams involving adiabatic processes without implying anything about the speed of changes. I can't really discuss reversibility since that makes it too specific, especially regarding PV^gamma. I think it’s acceptable to skip the mention of slopes since I can’t be sure. Also, for isothermal processes, they generally assume slow mechanics, but I should be careful about implying that reversibility is guaranteed. Omitting optional logs seems like the right approach here.

a) Diagrama P\times V

Nas etapas isotérmicas, a temperatura permanece constante:

T_2=T_1 \qquad\text{e}\qquad T_4=T_3.

A compressão adiabática II aumenta a temperatura do gás, de modo que T_3>T_1. Na expansão adiabática IV, a temperatura retorna a T_1.

O esboço qualitativo é:

P
↑
│      ● 3
│       ╲ ╲_______    III →
│        ╲        ╲______● 4
│     II ↖                ╲
│          ● 2             ↘ IV
│            ╲______        ╲
│                I ←╲________● 1
│
└───────────────────────────────→ V

As etapas são:

  • I — 1\to2: compressão isotérmica à temperatura T_1, com PV=RT_1;
  • II — 2\to3: compressão adiabática, com Q_2=0;
  • III — 3\to4: expansão isotérmica à temperatura T_3, com PV=RT_3;
  • IV — 4\to1: expansão adiabática, com Q_4=0.

b) Trabalho total

Adotando W>0 para o trabalho realizado pelo gás, a primeira lei da Termodinâmica é

\Delta U=Q-W.

Como as etapas II e IV são adiabáticas:

W_2=-\Delta U_2=U_2-U_3,
W_4=-\Delta U_4=U_4-U_1.

A energia interna de um gás ideal depende apenas da temperatura. Portanto,

T_2=T_1\Rightarrow U_2=U_1, \qquad T_4=T_3\Rightarrow U_4=U_3.

Assim,

W_2+W_4=(U_2-U_3)+(U_4-U_1)=0.

Somando os trabalhos das quatro etapas:

W_{\mathrm{tot}}=W_1+W_2+W_3+W_4 \quad\Rightarrow\quad \boxed{W_{\mathrm{tot}}=W_1+W_3}.

Resposta final: a) 1\xrightarrow{\text{isotérmica}}2\xrightarrow{\text{adiabática}}3\xrightarrow{\text{isotérmica}}4\xrightarrow{\text{adiabática}}1, conforme o esboço; b) W_{\mathrm{tot}}=W_1+W_3, pois W_2+W_4=0.

GPT-6.1 Sol

Respondeu · bate com a resposta de referência dos cursinhos

a) Ciclo horário, com duas isotermas (T_3>T_1) ligadas por duas adiabáticas, conforme o esboço; b) W_{\mathrm{tot}}=W_1+W_3, pois W_2+W_4=0.

levou 34 s

Como pensou

a) Gráfico P\times V

Na etapa I, a temperatura permanece em T_1. Na compressão adiabática da etapa II, o trabalho recebido aumenta a energia interna do gás, de modo que T_3>T_1. Assim, a isoterma da etapa III fica acima da isoterma da etapa I.

Um esboço qualitativo é:

P
↑
│       ● 3
│        ╲ ╲________
│   II ↑  ╲         ╲________ ● 4
│          ╲      III →         ╲
│           ● 2                 ╲  IV ↓
│             ╲_______           ╲
│                  I ← ╲__________● 1
│
└────────────────────────────────────→ V

As etapas são:

  • I — 1\to2: compressão isotérmica, PV=RT_1;
  • II — 2\to3: compressão adiabática, Q_2=0;
  • III — 3\to4: expansão isotérmica, PV=RT_3;
  • IV — 4\to1: expansão adiabática, Q_4=0.

O ciclo é percorrido no sentido horário. As ligações adiabáticas no desenho são esquemáticas, pois a rapidez das etapas não garante reversibilidade.

b) Trabalho total

Adotando W>0 para o trabalho realizado pelo gás, a primeira lei é

\Delta U=Q-W.

Como a energia interna de um gás ideal depende apenas da temperatura, nas etapas isotérmicas:

U_2=U_1 \qquad\text{e}\qquad U_4=U_3.

Nas duas etapas adiabáticas, Q=0. Portanto,

W_2=-\Delta U_2=-(U_3-U_2)

e

W_4=-\Delta U_4=-(U_1-U_4).

Somando e utilizando as igualdades anteriores:

W_2+W_4=-U_3+U_2-U_1+U_4=0.

Logo,

W_{\mathrm{tot}}=W_1+W_2+W_3+W_4 =\boxed{W_1+W_3}.

Resposta final: a) Ciclo horário, com duas isotermas (T_3>T_1) ligadas por duas adiabáticas, conforme o esboço; b) W_{\mathrm{tot}}=W_1+W_3, pois W_2+W_4=0.

GPT-6.1 Terra

Respondeu · bate com a resposta de referência dos cursinhos

a) ciclo com isotermas 1\to2 e 3\to4, ligadas pelas etapas adiabáticas 2\to3 e 4\to1; b) W_{\text{tot}}=W_1+W_3.

levou 26 s

Como pensou
**Considering adiabatic processes** I need to think through the rapid adiabatic nonequilibrium situation. There’s no well-defined pressure or reversible constraints, and it means I can’t rely on a unique P-V graph. I might need to draw a schematic with broken dashed connections instead of using gamma values. It looks like I should create a qualitative schematic with specific endpoints, keeping in mind that T3 is greater than T1 during adiabatic compression. The relationships between volumes and pressures aren't completely defined, which requires careful consideration on my part.**Visualizing states and paths** I’m organizing the states now. State 3 is positioned on the left with volume V3; state 2 might be somewhere before 4, which I’ll place on the right. I can stylize state 3 on the top left, moving towards state 4 on the top right, while bringing state 2 below it and state 1 toward the bottom right. The paths will have curves connecting them like hyperbolas, and I need to make sure they don’t intersect. I’ll also use dashed lines for fast paths. Time to sketch it out!

a) As etapas I e III são isotérmicas. Na compressão adiabática II, a temperatura aumenta; portanto, a isoterma da etapa III está acima da isoterma da etapa I.

Um esboço possível é:

P
↑
│   ● 3
│    ⋱  ╲_____→ ● 4       III: T₃
│     ⋱           ⋱
│      ● 2          ⋱
│        ╲_____←_____● 1   I: T₁
└────────────────────────→ V
       II            IV

As linhas pontilhadas indicam as ligações entre os estados nas etapas adiabáticas rápidas, II e IV. Como essas etapas não são necessariamente quase estáticas, suas trajetórias detalhadas no plano P\times V não são determinadas pelo enunciado.

b) Adotando W como o trabalho realizado pelo gás, a primeira lei é

\Delta U=Q-W.

Nas etapas II e IV, Q=0. Para um gás ideal, a energia interna depende apenas da temperatura. Como T_2=T_1 e T_4=T_3, resulta:

W_2=U(T_2)-U(T_3)=U(T_1)-U(T_3),
W_4=U(T_4)-U(T_1)=U(T_3)-U(T_1).

Logo, W_2+W_4=0 e

W_{\text{tot}}=W_1+W_2+W_3+W_4=W_1+W_3.

Para as etapas isotérmicas quase estáticas, pode-se ainda escrever

W_{\text{tot}} =RT_1\ln\frac{V_2}{V_1} +RT_3\ln\frac{V_4}{V_3}.

Resposta final: a) ciclo com isotermas 1\to2 e 3\to4, ligadas pelas etapas adiabáticas 2\to3 e 4\to1; b) W_{\text{tot}}=W_1+W_3.

GPT-6 Luna

Respondeu · bate com a resposta de referência dos cursinhos

a) ciclo 1\to2\to3\to4\to1, com etapas isotérmicas 1\to2 e 3\to4, e adiabáticas 2\to3 e 4\to1; b) W_{\mathrm{tot}}=W_1+W_3.

levou 47 s

Como pensou
**Sketching thermodynamic paths** I’m working on understanding work cancellation in relation to endpoints and ideal gas internal energy. I need to explain a P-V sketch with arrows and identify isothermal vs adiabatic processes. I think I can use ASCII to illustrate this, though not to scale. I’ll draw the axes and position states accordingly, ensuring I show V3 < V2 < V4 < V1. This arrangement will help analyze the thermodynamic possibilities and ratios for the adiabatic path.**Explaining adiabatic curves** I'm thinking about adiabatic curves on a P-V diagram. I want to show schematic arrows and label Q=0 to identify isotherms T1 and T3. It seems that for reversible adiabats, they’re steeper than isotherms, indicating faster but non-quasistatic processes. The exam likely expects me to explain this. I plan to draw a closed loop clockwise to depict compression and expansion sequences, checking the relationship between states and pressures. It’s crucial I ensure the diagram is clear and accurate!**Analyzing pressure-volume relationships** I’m considering the relationship between volumes and pressures, particularly if V4 is greater than V2. This results in a ratio involving P4 and P2, which I'm mapping onto my plot. The sketch needs to clarify that it's illustrative only, without a relative scale. I'll create a standard Carnot cycle figure. State 1 will be at the lower right, and I'll map out the stages of compression and expansion while ensuring the path from state 4 to 1 functions correctly on the adiabat. I’m aiming for clarity in my diagram!**Evaluating thermodynamic paths** I'm considering the differences between isothermal and adiabatic processes. The prompt states that adiabatic sections are steeper in a reversible or quasi-static context, but for irreversible fast paths, the detailed tracing isn't clear. The exam likely expects sketches shaped by adiabatic curves. It’s critical to note that during rapid adiabatic processes, paths aren't well-defined due to irreversibility. Ultimately, if we're sketching, I should use adiabatic curves for fast processes while accounting for endpoints and qualitative directions.**Analyzing P-V diagrams** I'm looking at how to plot states on a P-V diagram, noting that equilibrium states can be defined, but non-equilibrium states lack a specific gas pressure. The exam likely wants steep adiabatic lines represented. I want to be thoughtful about my schematic, perhaps adding a note indicating that reversible adiabatic processes are steeper. However, I'm realizing that during rapid compression, pressures may not increase steadily, which complicates things! The sketch will illustrate state transitions accurately, even if positions are swapped based on variable values.**Avoiding fixed implications in diagrams** I'm thinking about creating a symbolic diagram where I can place the states in a flexible manner. For instance, I could show state 1 on the right, states 2 and 3 further to the left, and state 4 positioned between states 3 and 1. It's important to note that the horizontal ordering of states 2 and 4 shouldn't be fixed since there's no specific information defining their arrangement. I need to make sure it allows for variations!**Creating a diagram** I’m considering how to draw a graph that demonstrates the relationship between different states. If point 3 connects to 4, and pressure (P) falls, volume should increase. I think state 2, at the lower left, is relative to state 1, while state 4 might be positioned to the right of state 2 on the diagram. The lines representing transitions could be curves, and I need to make sure they don’t cross. Adding labels and using dotted lines for the graph might help clarify things. Let's produce this!

a) Diagrama P\times V

Como a etapa I é isotérmica, T_2=T_1; como a etapa III é isotérmica, T_4=T_3. A compressão adiabática eleva a temperatura, portanto T_3>T_1. Assim, a isoterma T_3 fica acima da isoterma T_1.

Um esboço esquemático possível é:

       P
       ↑
       │       ● 3 ───────── ● 4     isoterma T₃
       │        ╲             ╲
       │         ╲             ╲
       │          ● 2           ╲
       │            ╲            ╲
       │             ─────────── ● 1   isoterma T₁
       └────────────────────────────→ V

O sentido do ciclo é 1\to2\to3\to4\to1: compressão isotérmica, compressão adiabática, expansão isotérmica e expansão adiabática, respectivamente. O desenho é ilustrativo; a posição relativa de 2 e 4 não é determinada pelos dados.

b) Trabalho total

Adotando W>0 para o trabalho realizado pelo gás, a primeira lei é

\Delta U=Q-W.

Nas etapas II e IV, Q_2=Q_4=0. Para um mol de gás ideal, a energia interna depende apenas da temperatura; logo,

\Delta U_2=C_V(T_3-T_1), \qquad \Delta U_4=C_V(T_1-T_3)=-\Delta U_2.

Como as etapas são adiabáticas, W_2=-\Delta U_2 e W_4=-\Delta U_4. Portanto,

W_2+W_4=0.

Somando os trabalhos das quatro etapas,

W_{\mathrm{tot}}=W_1+W_2+W_3+W_4 =W_1+W_3.

Resposta final: a) ciclo 1\to2\to3\to4\to1, com etapas isotérmicas 1\to2 e 3\to4, e adiabáticas 2\to3 e 4\to1; b) W_{\mathrm{tot}}=W_1+W_3.

Claude Fable 5.1

Respondeu · diferente da resposta de referência dos cursinhos

a) ciclo de Carnot anti‑horário no diagrama P×V: isotermas T₁ (1→2, compressão) e T₃ (3→4, expansão) ligadas por adiabáticas (2→3 compressão, 4→1 expansão), com V₃<V₂<V₁ e V₃<V₄<V₁; b) nas adiabáticas Q=0 ⇒ W₂ = −C_v(T₃−T₁) e W₄ = +C_v(T₃−T₁), logo W₂+W₄ = 0 e W_tot = W₁ + W₃ = RT₁ln(V₂/V₁) + RT₃ln(V₄/V₃).

levou 31 s

Como pensou
This looks like a reverse Carnot cycle (refrigerator): isothermal compression at T1, adiabatic compression raising temperature to T3, isothermal expansion at T3, then adiabatic expansion back to the initial state. I'm working through each stage's pressure-volume relationships to connect the four points of the cycle. For the PV sketch, I need two isotherms (T1 lower, T3 upper) joined by two steeper adiabatic curves, with the cycle traced counterclockwise and volumes satisfying V1/V2 = V4/V3. For the work analysis, since stages 2 and 4 are adiabatic, their heat exchange is zero, meaning the works done in those stages cancel each other out, so the net work comes only from the two isothermal stages. Using the convention that work is done by the system (W=∫PdV, ΔU=Q−W), the adiabatic works are W2 = −Cv(T3−T1) and W4 = Cv(T3−T1), confirming they sum to zero, while the isothermal works are W1 = nRT1 ln(V2/V1) and W3 = nRT3 ln(V4/V3). Since ΔU=0 over the full cycle, the total work equals the total heat absorbed, Q1+Q3. I'll present the final answer in Portuguese along with a simple diagram sketch of the cycle on a P-V plane.

Interpretação do processo

O gás parte de (P₁, V₁, T₁) e, como as etapas II e IV são adiabáticas (Q = 0) e as etapas I e III são isotérmicas, trata‑se de um ciclo de Carnot percorrido no sentido anti‑horário (ciclo de refrigeração):

  • Etapa I: compressão isotérmica a T₁ → V₂ < V₁, P₂ > P₁ (o gás cede calor Q₁ à fonte fria).
  • Etapa II: compressão adiabática → o gás aquece: T₃ > T₁, V₃ < V₂, P₃ > P₂.
  • Etapa III: expansão isotérmica a T₃ → V₄ > V₃, P₄ < P₃ (o gás recebe calor Q₃ da fonte quente).
  • Etapa IV: expansão adiabática → volta a (P₁, V₁, T₁), com V₁ > V₄, T cai de T₃ para T₁.

a) Gráfico P × V

P
|   3
|   *\              ← isoterma T3 (PV = RT3), mais alta
|    \ \  III
|     \  *4
|  II  \   \
|       *2   \  IV      ← curvas adiabáticas (PV^γ = cte), mais
|         \    \           inclinadas que as isotermas
|      I   \     \
|            `--*1     ← isoterma T1 (PV = RT1), mais baixa
|_____________________________ V
  • Pontos 1 e 2 sobre a hipérbole PV = RT₁ (isoterma inferior); pontos 3 e 4 sobre a hipérbole PV = RT₃ (isoterma superior).
  • Trechos 1→2 (Etapa I) e 3→4 (Etapa III): isotermas (hipérboles, menos inclinadas).
  • Trechos 2→3 (Etapa II) e 4→1 (Etapa IV): adiabáticas (PV^γ = cte, mais inclinadas que as isotermas).
  • O ciclo 1→2→3→4→1 é percorrido no sentido anti‑horário, com V₃ < V₂ < V₁ e V₃ < V₄ < V₁ (e V₁/V₂ = V₄/V₃).

b) Trabalho total

Adotando W como o trabalho realizado pelo gás, W = ∫P dV, a 1ª Lei dá ΔU = Q − W. Para um gás ideal, ΔU = n C_v ΔT (depende só da temperatura).

  • Etapa I (isotérmica, ΔT = 0 ⇒ ΔU = 0): W₁ = Q₁ = RT₁ ln(V₂/V₁) (< 0, compressão).
  • Etapa III (isotérmica): W₃ = Q₃ = RT₃ ln(V₄/V₃) (> 0, expansão).
  • Etapa II (adiabática, Q = 0): W₂ = −ΔU₂ = −C_v (T₃ − T₁).
  • Etapa IV (adiabática, Q = 0): W₄ = −ΔU₄ = −C_v (T₁ − T₃) = +C_v (T₃ − T₁).

Logo

W₂ + W₄ = −C_v(T₃ − T₁) + C_v(T₃ − T₁) = 0,

pois as duas adiabáticas ligam as mesmas isotermas (T₁ e T₃): a variação de energia interna numa é o oposto da outra e, sem troca de calor, o trabalho em cada uma é igual a −ΔU.

Portanto

W_tot = W₁ + W₂ + W₃ + W₄ = W₁ + W₃ = RT₁ ln(V₂/V₁) + RT₃ ln(V₄/V₃).

(Equivalentemente: no ciclo ΔU = 0, então W_tot = Q_tot = Q₁ + Q₃ = W₁ + W₃, já que as adiabáticas não trocam calor.) Como V₁/V₂ = V₄/V₃, resulta W_tot = R(T₃ − T₁) ln(V₄/V₃) > 0 em módulo igual ao trabalho líquido que deve ser fornecido ao sistema no ciclo frigorífico (W_tot calculado "pelo gás" é negativo quando V₂/V₁ < 1 pesa com T₁… o sinal depende da convenção; o essencial é a demonstração W₂ + W₄ = 0).

Resposta final: a) ciclo de Carnot anti‑horário no diagrama P×V: isotermas T₁ (1→2, compressão) e T₃ (3→4, expansão) ligadas por adiabáticas (2→3 compressão, 4→1 expansão), com V₃<V₂<V₁ e V₃<V₄<V₁; b) nas adiabáticas Q=0 ⇒ W₂ = −C_v(T₃−T₁) e W₄ = +C_v(T₃−T₁), logo W₂+W₄ = 0 e W_tot = W₁ + W₃ = RT₁ln(V₂/V₁) + RT₃ln(V₄/V₃).

Claude Opus 5.5

Respondeu · bate com a resposta de referência dos cursinhos

a) Ciclo de Carnot no diagrama P×V: 1→2 compressão isotérmica a T₁, 2→3 compressão adiabática até T₃ > T₁, 3→4 expansão isotérmica a T₃, 4→1 expansão adiabática de volta a T₁, percorrido no sentido horário; b) W₂ = −C_v(T₃−T₁) e W₄ = +C_v(T₃−T₁) se anulam, logo W_tot = W₁ + W₃ = R(T₃−T₁)ln(V₁/V₂).

levou 23 s

Como pensou
This looks like a reversed Carnot cycle acting as a refrigerator: isothermal compression at T1, adiabatic compression raising temperature to T3, isothermal expansion at T3, then adiabatic expansion back down to T1 to close the loop. Tracing the points on the PV diagram, going from 1 (bottom-right) left along the low isotherm to 2, then up the adiabat to 3, then right along the high isotherm to 4, then down back to 1 — that traces a clockwise loop, meaning net positive work is done by the gas, consistent with this being a Carnot engine that absorbs heat at T3 and rejects heat at T1. For the work calculation, I note the adiabatic legs contribute canceling terms (Cv(T3−T1) and Cv(T1−T3)), so the net work comes purely from the two isothermal legs, giving Wtot = R(T3−T1)ln(V1/V2), with the volume ratios V4/V3 = V1/V2 linking the adiabats together.

Leitura do ciclo. As etapas I e III são isotérmicas e reversíveis, já que são lentas. As etapas II e IV são adiabáticas, porque são tão rápidas que não há troca de calor (Q = 0).

Na etapa II o gás é comprimido sem trocar calor, logo esquenta: T₃ > T₁. A etapa III ocorre então na isoterma T₃ (quente). A etapa IV é uma expansão adiabática que esfria o gás de T₃ até T₁. Trata-se de um ciclo de Carnot.

a) Esboço do gráfico P × V

O gráfico tem duas isotermas (hipérboles, PV = cte) e dois trechos adiabáticos, mais inclinados (PV^γ = cte).

  • 1 → 2 (Etapa I): compressão isotérmica sobre a isoterma inferior T₁. O ponto se desloca para a esquerda: V₂ < V₁ e P₂ > P₁.
  • 2 → 3 (Etapa II): compressão adiabática, curva mais íngreme que a isoterma. O ponto sobe até a isoterma superior T₃: V₃ < V₂ e P₃ > P₂.
  • 3 → 4 (Etapa III): expansão isotérmica sobre a isoterma superior T₃. O ponto se desloca para a direita: V₄ > V₃.
  • 4 → 1 (Etapa IV): expansão adiabática, que desce de T₃ até o ponto 1 na isoterma T₁.
P
|   3
|   |\        (isoterma T3)
|   | \ _
|   \     ‾‾--4
|  2 \          \   (adiabática 4→1)
|   \  ‾‾--__     \
|    (isot. T1)‾‾--1
|_________________________ V

Ordem dos volumes: V₃ < V₂ e V₄ < V₁. Das adiabáticas vem V₄/V₃ = V₁/V₂. O ciclo é percorrido no sentido horário e a área interna corresponde ao trabalho líquido.

b) Trabalho total

Pela 1ª Lei, ΔU = Q − W, com W sendo o trabalho realizado pelo gás. Para gás ideal, U depende só de T.

  • Etapa I (isotérmica): ΔU₁ = 0, então W₁ = Q₁ = RT₁ ln(V₂/V₁). Esse valor é negativo, pois é compressão.
  • Etapa III (isotérmica): ΔU₃ = 0, então W₃ = Q₃ = RT₃ ln(V₄/V₃). Esse valor é positivo, pois é expansão.
  • Etapa II (adiabática, Q = 0): W₂ = −ΔU₂ = −C_v(T₃ − T₁).
  • Etapa IV (adiabática, Q = 0): W₄ = −ΔU₄ = −C_v(T₁ − T₃) = +C_v(T₃ − T₁).

Como as duas adiabáticas operam entre as mesmas temperaturas T₁ e T₃, em sentidos opostos:

W₂ + W₄ = −C_v(T₃ − T₁) + C_v(T₃ − T₁) = 0

Portanto:

W_tot = W₁ + W₂ + W₃ + W₄ = W₁ + W₃

Usando V₄/V₃ = V₁/V₂, obtém-se W_tot = R(T₃ − T₁) ln(V₁/V₂) > 0.

Resposta final: a) Ciclo de Carnot no diagrama P×V: 1→2 compressão isotérmica a T₁, 2→3 compressão adiabática até T₃ > T₁, 3→4 expansão isotérmica a T₃, 4→1 expansão adiabática de volta a T₁, percorrido no sentido horário; b) W₂ = −C_v(T₃−T₁) e W₄ = +C_v(T₃−T₁) se anulam, logo W_tot = W₁ + W₃ = R(T₃−T₁)ln(V₁/V₂).

Claude Sonnet 5.5

Respondeu · bate com a resposta de referência dos cursinhos

a) ciclo horário com 1→2 isoterma T₁ (compressão), 2→3 adiabática (compressão, sobe até a isoterma T₃), 3→4 isoterma T₃ (expansão), 4→1 adiabática (expansão); b) W₂ = −nC_V(T₃−T₁) e W₄ = +nC_V(T₃−T₁), logo W₂ + W₄ = 0 e W_tot = W₁ + W₃.

levou 20 s

Como pensou
I'm mapping out the four-step cycle: isothermal compression at T1, fast adiabatic compression raising temperature to T3, slow isothermal expansion at T3, then fast adiabatic expansion back to the initial state. For the adiabatic steps, since Q=0, work equals negative ΔU, and since internal energy depends only on temperature for an ideal gas (regardless of reversibility), the work in step II (ΔU = nCv(T3−T1)) exactly cancels the work in step IV (ΔU = nCv(T1−T3)), proving W2+W4=0. I'm now sketching the P-V diagram, placing point 1 at larger volume, tracing the lower isotherm to point 2, the steep adiabatic rise to point 3, the upper isotherm expansion to point 4, and the adiabatic drop back to point 1, forming a Carnot-like loop. Tracing the direction, this path goes clockwise, confirming it behaves as a heat engine doing positive net work—consistent with a Carnot cycle with hot expansion on top and cold compression on bottom. I should note that because the process is "muito rápida," the states aren't quasi-static, so the diagram path might be better shown as dashed to indicate it's an idealized approximation rather than a true equilibrium trajectory. For the total work, I'm adding W1+W2+W3+W4, noting W2 and W4 cancel since they're adiabatic steps summing to zero over the cycle, while W1 and W3 are the isothermal works given by RT ln(V_f/V_i) expressions. I'll keep sign conventions consistent with ΔU = Q − W throughout.
Interpretação

Os estados são:

  • 1 → 2: compressão isotérmica lenta a T₁, logo T₂ = T₁.
  • 2 → 3: compressão adiabática rápida. O gás se aquece, então T₃ > T₁.
  • 3 → 4: expansão isotérmica lenta a T₃, logo T₄ = T₃.
  • 4 → 1: expansão adiabática rápida. O gás se resfria de T₃ até T₁, voltando ao estado inicial.
a) Gráfico P × V

Esboço qualitativo, com V no eixo horizontal e P no vertical:

P
|        3 ●━━━━━━━╲  (isoterma T₃, etapa III)
|        ┃          ╲
|        ┃ (II)      ╲●4
|        ┃             ┃
|     2 ●╲             ┃ (IV)
|         ╲ (I)        ┃
|          ╲___________●1
|             (isoterma T₁)
+------------------------------ V
         V₃  V₂      V₄   V₁
  • Etapa I (1→2): curva hiperbólica P = RT₁/V, a isoterma inferior. O volume diminui e a pressão aumenta.
  • Etapa II (2→3): curva adiabática, mais inclinada que as isotermas. O volume diminui e a pressão sobe até a isoterma superior (T₃).
  • Etapa III (3→4): curva hiperbólica P = RT₃/V, a isoterma superior. O volume aumenta e a pressão diminui.
  • Etapa IV (4→1): curva adiabática. O volume aumenta e a pressão diminui até o ponto inicial.

O ciclo é percorrido no sentido horário. As etapas II e IV são rápidas e, a rigor, não são quase-estáticas, então seus trajetos seriam desenhados tracejados. Apenas os estados extremos estão bem definidos.

b) Trabalho total

O trabalho total é W_tot = W₁ + W₂ + W₃ + W₄.

Nas etapas II e IV não há troca de calor, Q = 0. Pela 1ª lei, ΔU = Q − W, então W = −ΔU. Essa relação vale mesmo para processos rápidos e irreversíveis, pois depende só de Q = 0.

Para um gás ideal, U depende apenas de T, e ΔU = C_V ΔT, com C_V constante:

  • Etapa II: W₂ = −ΔU₂ = −nC_V(T₃ − T₁).
  • Etapa IV: W₄ = −ΔU₄ = −nC_V(T₁ − T₃) = +nC_V(T₃ − T₁).

Portanto W₂ + W₄ = 0.

Assim:

W_tot = W₁ + W₃ + (W₂ + W₄) = W₁ + W₃

Se as etapas isotérmicas forem reversíveis (lentas), W₁ = RT₁ ln(V₂/V₁) < 0 e W₃ = RT₃ ln(V₄/V₃) > 0. O trabalho líquido é então W_tot = R[T₃ ln(V₄/V₃) − T₁ ln(V₁/V₂)].

Resposta final: a) ciclo horário com 1→2 isoterma T₁ (compressão), 2→3 adiabática (compressão, sobe até a isoterma T₃), 3→4 isoterma T₃ (expansão), 4→1 adiabática (expansão); b) W₂ = −nC_V(T₃−T₁) e W₄ = +nC_V(T₃−T₁), logo W₂ + W₄ = 0 e W_tot = W₁ + W₃.

Grok 4.7

Respondeu · bate com a resposta de referência dos cursinhos

a) isotermas T_1 (I) e T_3>T_1 (III) + ligações irreversíveis II e IV; b) W_{\rm tot}=W_1+W_3

levou 1 min 18 s

Como pensou
The problem is from IME 2027, second phase, Chemistry. The problem involves a four-stage thermodynamic cycle for one mole of ideal gas. Stages I and III are slow isothermal processes. Stages II and IV are rapid adiabatic compression and expansion. The first part requires sketching the P-V graph and identifying each stage. The second part requires proving that total work equals W1 plus W3. This implies the adiabatic stages contribute no net work. I am beginning with the slow isothermal compression. The isothermal compression follows PV = constant, so P2 exceeds P1 and V2 is smaller than V1. The rapid compression in stage II is irreversible adiabatic. I am considering how to calculate work for this non-reversible process. I am analyzing why the adiabatic stages contribute no net work. Since internal energy depends only on temperature, the total change in internal energy over a complete cycle is zero, which implies the total work equals the negative of the total heat exchange. I am also questioning whether rapid compression could somehow produce zero work, though that seems unlikely. I am mapping the four states of the cycle. The isothermal compression in stage I traces a hyperbola from V1 to V2. The rapid adiabatic compression in stage II and the rapid adiabatic expansion in stage IV are the remaining segments to plot. I am testing the sign convention ΔU = Q + W, where W is work done on the system. For adiabatic stages II and IV, Q = 0, so W equals ΔU. I need to verify whether this yields W2 + W4 = 0. The proof is complete. Because internal energy depends only on temperature, the adiabatic stages yield W2 = U(T3) − U(T1) and W4 = U(T1) − U(T3). Their sum is zero. Therefore W_total equals W1 plus W3. The cancellation of the adiabatic works holds under either sign convention, so part b is confirmed. I am now sketching the P-V graph for part a) and determining how the four states relate. The graph will be purely qualitative. Because the cycle returns to its initial state, T3 must equal T1. The rapid adiabatic compression in stage II therefore raises temperature above T1, so T3 exceeds T2 and T1. I am now ordering the four states on the P-V diagram. The rapid adiabatic expansion in stage IV cools the gas from T3 back to T1, so T4 equals T1. The volume sequence is V2 < V3 < V4 < V1, and the pressure sequence is P1 < P2 < P3 > P4. I am using these relative sizes to sketch the four segments. The rapid adiabatic stages are irreversible and non-equilibrium. The system pressure is not uniform, so the path cannot be drawn as a smooth curve of equilibrium states. In typical exam sketches, these segments are shown as straight lines or arrows connecting the two states. I am reconsidering the sketch for part a). Because the rapid adiabatic stages are irreversible, the system pressure is not uniform and lacks a well-defined value. This makes it ambiguous to plot those segments on a P-V diagram. I am now framing the solution as a candidate would write it on the exam, with full Portuguese development and a final answer block. The sketch is schematic. The four states can be arranged almost arbitrarily, provided the volumes decrease during compression and increase during expansion, and T3 exceeds T1. Because the rapid adiabatic stages are irreversible, the exact path between states depends on the external pressure schedule. The sketch description now includes the remaining segments. Stage III is an isothermal expansion from (V3, P3) to (V4, P4), with V4 larger than V3 and P4 smaller than P3. Stage IV is a rapid adiabatic expansion returning to (V1, P1), where V1 exceeds V4 and temperature drops from T3 to T1. Because no numerical data are given, the drawing can remain schematic. I am refining the sketch for part a). The rapid adiabatic stages are irreversible, so the system pressure is not uniform and the path cannot be drawn as a smooth curve. I will represent these segments by connecting the two equilibrium states with straight lines or arrows, rather than attempting to plot the non-equilibrium pressure variation.

A primeira lei será usada na convenção \Delta U=Q+W (trabalho realizado sobre o sistema). Como n=1, vale PV=RT.

a) No diagrama P\times V, o ciclo é percorrido na ordem 1\to2\to3\to4\to1:

  • Etapa I (compressão lenta e isotérmica): arco de hipérbole da isoterma T_1, do ponto (V_1,P_1) ao ponto (V_2,P_2), com V_2<V_1 e P_2>P_1.
  • Etapa II (compressão muito rápida, portanto adiabática e irreversível): os estados intermediários não são de equilíbrio, de modo que se ligam simplesmente os pontos 2 e 3, com V_3<V_2. O trabalho realizado sobre o gás é positivo, logo T_3>T_1 e o ponto 3 situa-se na isoterma mais alta.
  • Etapa III (expansão lenta e isotérmica): arco de hipérbole da isoterma T_3, do ponto (V_3,P_3) ao ponto (V_4,P_4), com V_4>V_3 e P_4<P_3.
  • Etapa IV (expansão muito rápida, adiabática e irreversível): ligação direta do ponto 4 de volta ao ponto 1, com V_1>V_4, a temperatura caindo de T_3 para T_1.

(As desigualdades de volume decorrem diretamente das compressões e expansões enunciadas; a isoterma T_3 fica acima da isoterma T_1.)

b) Nas etapas II e IV não há troca de calor:

Q_2=0\quad\Rightarrow\quad W_2=\Delta U_2=U_3-U_2,
Q_4=0\quad\Rightarrow\quad W_4=\Delta U_4=U_1-U_4.

Para gás ideal, U depende apenas de T. A etapa I é isotérmica, portanto T_2=T_1 e U_2=U_1. A etapa III é isotérmica, portanto T_4=T_3 e U_4=U_3. Substituindo,

W_2=U_3-U_1,\qquad W_4=U_1-U_3,

donde W_2+W_4=0. Consequentemente

W_{\rm tot}=W_1+W_2+W_3+W_4=W_1+W_3.

Resposta final: a) isotermas T_1 (I) e T_3>T_1 (III) + ligações irreversíveis II e IV; b) W_{\rm tot}=W_1+W_3

DeepSeek V4.1 Flash

Respondeu · bate com a resposta de referência dos cursinhos

a) gráfico P\times V com 1\to2 isoterma de compressão, 2\to3 adiabática de compressão, 3\to4 isoterma de expansão e 4\to1 adiabática de expansão; b) W_{\text{tot}}=W_1+W_3.

levou 19 s

Como pensou
We need answer in Portuguese, show development item by item. Need solve question. Let's parse. Question: A system, composed of one mole ideal gas, initial state P1,V1,T1. undergoes state change in four steps: - Etapa I - compressão lenta e isotérmica a P2,V2. - Etapa II - compressão muito rápida a P3,V3,T3. - Etapa III - expansão lenta e isotérmica a P4,V4. - Etapa IV - expansão muito rápida de volta ao estado inicial a P1,V1,T1. Second and fourth stages so rapid no heat exchange between system and environment (adiabatic). a) sketch P x V graph, identifying steps. b) considering W1,W2,W3,W4 works in each step, show total work in described process reduces to Wtot = W1 + W3. Need answer. Need maybe derive. Let's understand process. Initial state 1: (P1,V1,T1). Step I isothermal compression slowly to (P2,V2) at T1 (since isothermal). So T2 = T1. P1 V1 = P2 V2? ideal gas n=1: PV=RT, so P1V1=RT1 = P2V2. Since compression V2<V1, P2>P1. Step II rapid compression to P3,V3,T3. No heat exchange Q2=0, adiabatic. Since compression, work done on gas, internal energy increases, T3 > T2 = T1? likely T3 > T1. State 3. Step III slow isothermal expansion to P4,V4. T4 = T3 (isothermal at T3). P3 V3 = P4 V4 = R T3. Since expansion V4>V3, P4<P3. Step IV rapid expansion back to initial P1,V1,T1. Adiabatic (Q4=0). Expansion, work done by gas, internal energy decreases, T returns to T1. So state 4 to 1 adiabatic. Need graph P x V: Four points? Steps I and III are isotherms (curves PV=const), II and IV are adiabats (curves PV^γ=const? For ideal gas adiabatic reversible? "muito rápida" no heat exchange but maybe irreversible? However for ideal gas adiabatic process with no heat exchange, if rapid maybe not quasi-static? But likely treat as reversible adiabatic? In thermodynamics, "muito rápida" means adiabatic (Q=0), not necessarily reversible. But for work calculation, if irreversible adiabatic, work equals -ΔU = n Cv (T_initial - T_final)? Need examine. The problem asks show Wtot = W1 + W3, maybe because W2 + W4 = 0? Wait adiabatic work W2 + W4 maybe cancel? Let's see. For ideal gas, internal energy depends only T. Over cycle, ΔU_total = 0 = Q_total + W_total (with sign convention? Need careful: First law ΔU = Q - W? In Portuguese, work W usually realizado pelo gás? They define W1,W2,W3,W4 as trabalhos em cada etapa. Total work? Need sign. Let's infer. In many Brazilian thermodynamics: ΔU = Q - W, where W is work done by gas (expansão positive? Actually sometimes W = work done by gas, so ΔU = Q - W; if gas receives work, W negative). They ask show Wtot = W1 + W3. If W2 + W4 cancel? Let's compute. For adiabatic steps: Q=0, ΔU = -W (if W by gas). For one mole ideal gas, ΔU = Cv ΔT (assuming Cv constant). Thus W = -ΔU = -Cv ΔT? Wait if ΔU = Q - W, then 0 = ΔU + W => W = -ΔU = -Cv ΔT. For compression (T increases), ΔT>0, W<0 (work done on gas). For expansion, ΔT<0, W>0. For step II: W2 = -Cv (T3 - T1) = Cv(T1 - T3). Step IV: W4 = -Cv (T1 - T3) = Cv(T3 - T1) = -W2. So W2 + W4 =0. Then Wtot = W1+W3. This is simple. Even if irreversible, internal energy state function, Q=0, so W = -ΔU = -Cv ΔT for each adiabatic step, regardless of reversibility. So W2+W4=0. Good. But need graph. Need describe shape. Since steps I and III are isotherms, II and IV adiabats. But note order: I isothermal compression from state 1 to state 2 (lower volume, higher pressure) at T1. II adiabatic compression from state 2 to state 3 (further lower volume? Actually "compressão muito rápida a P3,V3,T3": compression means V3<V2, P3>P2, T3>T1). III isothermal expansion at T3 from state 3 to state 4 (V4>V3, P4<P3). IV adiabatic expansion from state 4 back to state1 (V1>V4? Wait final volume V1; since from state 4 to 1 expansion: V1 > V4? But state 1 initial volume V1; state 4 likely has V4 < V1? Let's think. Overall cycle: compression I, compression II, expansion III, expansion IV. Net work? The cycle likely is a refrigeration? Need graph. Let's assign volumes: Start V1. Step I isothermal compression: V2 < V1. Step II adiabatic compression: V3 < V2. Step III isothermal expansion: V4 > V3. Step IV adiabatic expansion back to V1: V1 > V4? Since expansion, yes V1 > V4. But can V4 be less than V2? Let's analyze. The cycle consists of two isotherms and two adiabats, but isotherms at T1 and T3; adiabats between them. This is like Carnot cycle? Wait standard Carnot cycle has two isotherms and two adiabats. Here order: isothermal compression at T_low? Actually T1 maybe lower than T3? Since adiabatic compression raises T from T1 to T3, so T3 > T1. Then isothermal expansion at T_high T3, then adiabatic expansion back to T1. This is a Carnot cycle? Standard Carnot: isothermal expansion at T_high, adiabatic expansion to T_low, isothermal compression at T_low, adiabatic compression back to T_high. Here order: isothermal compression at T1 (low), adiabatic compression to T3 (high), isothermal expansion at T3 (high), adiabatic expansion to T1 (low). So it's reversed Carnot? Actually if T1<T3, then isothermal compression at low T, adiabatic compression to high T, isothermal expansion at high T, adiabatic expansion to low T. This is a Carnot cycle but direction? Standard heat engine: high T isothermal expansion, adiabatic expansion to low T, low T isothermal compression, adiabatic compression to high T. Here first isothermal compression at low T, then adiabatic compression to high T, then isothermal expansion at high T, then adiabatic expansion to low T. That's a refrigerator/heat pump? Let's see: Work input? For heat engine, net work positive (area clockwise). Here sequence: compression at low T (work input), compression adiabatic (work input), expansion at high T (work output), expansion adiabatic (work output). Net maybe positive? Let's calculate area: From 1 to 2: compression at T1, work negative (gas receives). 2 to 3: adiabatic compression, work negative. 3 to 4: isothermal expansion at T3, work positive. 4 to 1: adiabatic expansion, work positive. Net area may be positive if high T expansion > low T compression? Since high T isotherm area larger? Actually if V4 and V1? Let's determine. For Carnot, if T3>T1, isothermal expansion at T3 from V3 to V4, isothermal compression at T1 from V1 to V2, and adiabatic relations: T1 V1^{γ-1} = T3 V4^{γ-1}? Wait for adiabatic from 4 to 1: T3 V4^{γ-1} = T1 V1^{γ-1}. For adiabatic from 2 to 3: T1 V2^{γ-1} = T3 V3^{γ-1}. Then V1/V4 = (T3/T1)^{1/(γ-1)}, V2/V3 = (T3/T1)^{1/(γ-1)}? Let's derive: T1 V2^{γ-1}=T3 V3^{γ-1} => V2/V3 = (T3/T1)^{1/(γ-1)} >1, so V2 > V3. Also T3 V4^{γ-1}=T1 V1^{γ-1} => V1/V4 = (T3/T1)^{1/(γ-1)} >1, so V1 > V4. Thus V1 > V4 and V2 > V3. Also V2 < V1 (compression I), V3 < V2 (compression II), V4 > V3 (expansion III). So order of volumes: V3 < V2 < V1? And V3 < V4 < V1? Need compare V4 vs V2. From V2/V3 = V1/V4 = r >1 => V2 = r V3, V1 = r V4. Also V2 < V1 => r V3 < r V4 => V3 < V4. So order: V3 < V4 < V2 < V1? Check V2 vs V4: V2 = r V3, V4 = V1/r. Not necessarily. Example T3/T1=2, γ=1.4, r=2^{2.5}=5.657. If V3=1, V2=5.657; V4 = V1/r. Need V1? V1 maybe > V2? Since V2 < V1, so V1 >5.657. Then V4 = V1/5.657 >1. Could be less or greater than V2? If V1=10, V4=1.77 <5.657. So V4 < V2. So order V3 < V4 < V2 < V1 likely. But graph can be schematic. Need draw P-V diagram: x-axis V, y-axis P. Four points: 1 (V1,P1) lower pressure? State 1 initial maybe lower pressure than P2? Step I compression: from 1 to 2 along isotherm T1: as V decreases, P increases. So curve 1->2 downward? Actually P increases as V decreases, so from right (V1) to left (V2), curve up. State 2 higher P, lower V. Step II adiabatic compression from 2 to 3: V decreases further, P increases further, T increases. Adiabat steeper than isotherm? In P-V, adiabat has slope -γ P/V, steeper than isotherm slope -P/V. Since γ>1, adiabat steeper. So from 2 to 3, curve continues up-left with steeper slope. State 3 highest P? Probably P3 > P2. Step III isothermal expansion at T3 from 3 to 4: V increases, P decreases along isotherm T3 (higher T). It will cross? State 4 maybe lower P than P3 but higher T; likely P4 could be lower than P1? Let's see. Step IV adiabatic expansion from 4 to 1: V increases to V1, P decreases to P1, T decreases to T1. Adiabat steeper than isotherm? From 4 to 1, expansion, P drops. The curve 4->1 should be adiabat at lower T? Actually between T3 and T1. Need identify steps on graph: I (1→2) isothermal compression; II (2→3) adiabatic compression; III (3→4) isothermal expansion; IV (4→1) adiabatic expansion. Need maybe note that steps II and IV are adiabatic (Q=0), so no heat exchange. Could also show arrows. For b) We need "considerando que W1, W2, W3 e W4 são os trabalhos em cada etapa, mostre que o trabalho total no processo descrito se reduz a Wtot = W1 + W3." Need define sign convention. We can assume W is work done by gas? But they ask show. Let's develop. Let's use first law for closed system: ΔU = Q - W, where W is work done by the gas. In cycle, ΔU_total = 0, Q_total = Q1+Q2+Q3+Q4. For adiabatic steps Q2=Q4=0. But to show Wtot = W1+W3, need W2+W4=0. For ideal gas, internal energy U depends only on T. For each adiabatic step, Q=0, so ΔU = -W. Thus W = -ΔU = -n Cv ΔT. For one mole, W2 = -Cv (T3 - T1) = Cv(T1 - T3). W4 = -Cv (T1 - T3) = Cv(T3 - T1). Therefore W2 + W4 = 0. Hence Wtot = W1 + W2 + W3 + W4 = W1 + W3. Alternatively use first law for entire cycle: ΔU=0 => Wtot = Q_total = Q1+Q3 (since Q2=Q4=0). But that doesn't show W2+W4=0. Need show. We can also note work in adiabatic processes depends only on temperatures, and T2=T1, T4=T3, so ΔU2 = Cv(T3-T1), ΔU4 = Cv(T1-T3) = -ΔU2, hence W2 = -W4. Need maybe if W sign convention opposite, still W2+W4=0. Need be careful: In step II, compression rapid: Q=0, work done on gas. If W defined as work done by gas, W2 negative. Step IV expansion, W4 positive. Magnitudes equal because ΔT magnitudes equal? Actually T3-T1 for II; T1-T3 for IV (magnitude same). Yes. Could also derive using adiabatic relations: For ideal gas, W_adiabatic = (P_f V_f - P_i V_i)/(γ-1)? Wait formula for reversible adiabatic: W = (P1V1 - P2V2)/(γ-1) = nR(T1 - T2)/(γ-1). For step II: W2 = (P2V2 - P3V3)/(γ-1) = R(T1 - T3)/(γ-1) (since P V = RT, n=1). Step IV: W4 = (P4V4 - P1V1)/(γ-1) = R(T3 - T1)/(γ-1). Sum zero. But this assumes reversible adiabatic? Actually formula W = (P_i V_i - P_f V_f)/(γ-1) for reversible adiabatic. But if irreversible adiabatic, the formula may not hold, but internal energy argument holds generally. However in many exams, they may treat "muito rápida" as adiabatic but irreversible? Let's examine. The problem statement: "A segunda e a quarta etapas são tão rápidas que não há troca de calor entre o sistema e o ambiente." That defines adiabatic (Q=0), not necessarily reversible. But to calculate work in irreversible adiabatic, we cannot use PV^γ=const, but we can use ΔU=Q-W = -W, so W=-ΔU = -Cv ΔT. This is general for any adiabatic process of ideal gas, regardless of reversibility, provided initial and final temperatures known. So W2 = -Cv(T3-T1), W4 = -Cv(T1-T3) = Cv(T3-T1), sum zero. So robust. Need maybe in b) "mostre que o trabalho total ... se reduz a Wtot = W1 + W3." We can present. Need maybe mention for cycle ΔU=0, so Wtot = Q_total = Q1+Q3? But not enough. Use adiabatic steps. Let's craft final answer in Portuguese. Need include graph description maybe textual since no drawing? They ask "esboce o gráfico P x V". As text, we can describe. But maybe need include a sketch? Since it's a text answer, we can describe axes, curves, points, arrows. Could also include ASCII? Probably sufficient to describe. But maybe we should provide a simple diagram? We can't draw, but can describe. Let's formulate: a) Esboço: eixos P (ordenada) e V (abscissa). Marcar estados 1,2,3,4. - Estado 1: (V1,P1), T1. - Etapa I: compressão isotérmica lenta de 1 até 2 (T1 constante). Curva PV=const, com V2<V1 e P2>P1; no gráfico, curva descendente da esquerda para direita? Actually from 1 to 2: V decreases, P increases. So curve from right (V1) to left (V2), upward. It's a hipérbole. - Etapa II: compressão adiabática rápida de 2 até 3. Curva mais inclinada que a isoterma (PV^γ=const se reversível; mas em qualquer caso adiabática), com V3<V2, P3>P2, T3>T1. Seta de 2 para 3. - Etapa III: expansão isotérmica lenta de 3 até 4 (T3 constante). Curva PV=const, com V4>V3, P4<P3. Seta de 3 para 4. - Etapa IV: expansão adiabática rápida de 4 até 1. Curva adiabática, com V1>V4, P1<P4, T1<T3. Seta de 4 para 1. O ciclo fica no sentido 1→2→3→4→1. As etapas II e IV são adiabáticas (Q=0); I e III são isotérmicas. As isotermas I e III estão em temperaturas T1 e T3 (T3>T1), e as adiabáticas II e IV conectam essas isotermas. Maybe also note relative positions: V3 < V4 < V2 < V1? Let's verify with Carnot. Let's derive order maybe: From adiabatic relations: T1 V2^{γ-1}=T3 V3^{γ-1} => V2/V3=(T3/T1)^{1/(γ-1)}>1 => V2>V3. T3 V4^{γ-1}=T1 V1^{γ-1} => V1/V4=(T3/T1)^{1/(γ-1)}>1 => V1>V4. Also V2<V1 (I), V4>V3 (III). Compare V4 and V2: V4 = V1 / r, V2 = r V3? Wait r=(T3/T1)^{1/(γ-1)}. V1>V2 = r V3? Actually V2 = r V3. V4 = V1 / r. Since V1 > V2 = r V3, V4 > (r V3)/r = V3. But V4 could be less than V2 if V1 < r^2 V3? Not necessarily. Let's use known Carnot cycle: V1 (after adiabatic expansion) > V4 (before) and V2 (after isothermal compression) > V3 (after adiabatic compression). Also V4 > V3? Yes. Compare V2 and V4: V2/V4 = (r V3)/(V1/r) = r^2 V3 / V1. Since V1 = r V4 => V2/V4 = r V3 / V4? Hmm. For Carnot, the order of volumes depends on temperatures and γ. But not needed. We can just describe qualitatively. Maybe in graph, step III is isothermal expansion at T3 from smaller volume to larger volume, but it may not cross to right of V1? It could be V4 < V1. Since step IV expands to V1. So V4 is left of V1. Step I starts at V1 and compresses to V2; V2 maybe right of V3. So V3 < V2 < V1 and V3 < V4 < V1. The relative V2 vs V4 uncertain. But can draw typical. b) Development: Pela Primeira Lei: ΔU = Q - W (W realizado pelo gás). Para 1 mol de gás ideal, U = Cv T (ou ΔU = Cv ΔT). Etapa II (adiabática): Q2 = 0. Como T2 = T1 (etapa I isotérmica) e o estado final é T3: ΔU2 = Cv(T3 - T1). Assim, W2 = Q2 - ΔU2 = -Cv(T3 - T1) = Cv(T1 - T3). Etapa IV (adiabática): Q4 = 0. Estado inicial T4 = T3 (etapa III isotérmica) e final T1: ΔU4 = Cv(T1 - T3). Assim, W4 = Q4 - ΔU4 = -Cv(T1 - T3) = Cv(T3 - T1). Portanto, W2 + W4 = Cv(T1 - T3) + Cv(T3 - T1) = 0. O trabalho total no ciclo é: Wtot = W1 + W2 + W3 + W4 = W1 + W3 + (W2 + W4) = W1 + W3. Como queríamos demonstrar. Maybe if using ΔU = Q + W? In some conventions W is work done on system, then ΔU = Q + W; then W2 + W4 =? Let's be consistent. In Brazilian IME? Usually "trabalho" in thermodynamics: W = work done by gas? Let's see from statement: "considerando que W1, W2, W3 e W4 são os trabalhos em cada etapa" no sign. In many Brazilian physics, work done by gas is positive when expansion; first law ΔU = Q - W. If they use ΔU = Q + W (work received), then W2+W4=0 still? Let's check: If W received, adiabatic ΔU = W_received = Cv ΔT. For step II, ΔU = Cv(T3-T1) positive, W2_received = Cv(T3-T1). Step IV, ΔU = Cv(T1-T3) negative, W4_received = Cv(T1-T3). Sum = 0. Then total W_received = W1+W3? But W1+W3 maybe negative/positive? But same. So okay. Need maybe mention "desprezando variação de energia cinética/potencial" etc. Let's ensure no other nuance: The problem says "um sistema, composto por um mol de um gás ideal, está em um estado inicial a uma pressão P1, volume V1 e temperatura T1. Tal sistema sofre mudança de estado em quatro etapas:" Then list. "A segunda e a quarta etapas são tão rápidas que não há troca de calor entre o sistema e o ambiente." So indeed adiabatic. They ask "a) esboce o gráfico P x V do processo descrito, identificando as etapas. b) considerando que W1, W2, W3 e W4 são os trabalhos em cada etapa, mostre que o trabalho total no processo descrito se reduz a Wtot = W1 + W3." Maybe there is another possible answer: For adiabatic processes, work equals area under curve; maybe they want show W2 = -W4 by comparing areas? But internal energy easier. Let's think if there is any trick: In step II and IV, "muito rápida" implies no heat exchange, but also maybe irreversibility? However for ideal gas, internal energy depends only on T, so regardless of path, ΔU = Cv ΔT. So yes. Need maybe discuss sign of work: For compression, W negative if work done by gas. In step II compression, W2 <0; step IV expansion, W4 >0; sum zero. In final answer, perhaps state "adotando W como trabalho realizado pelo gás". But if not, just show. Let's craft final response with item a and b. Potential final: a) No gráfico P×V, marcar: - Eixo horizontal: V; vertical: P. - Estado 1: (V1,P1), sobre a isoterma T1. - I: curva 1→2, isoterma (PV=cte) de compressão; V2<V1, P2>P1. - II: curva 2→3, adiabática de compressão; V3<V2, P3>P2, T3>T1; curva mais inclinada que a isoterma. - III: curva 3→4, isoterma (PV=cte) de expansão; V4>V3, P4<P3, temperatura T3. - IV: curva 4→1, adiabática de expansão; V1>V4, P1<P4, retornando a T1. As setas indicam 1→2→3→4→1. As etapas I e III são lentas/isotérmicas; II e IV são rápidas/adiabáticas (Q=0). b) Pela 1ª Lei da Termodinâmica para 1 mol de gás ideal: ΔU = Q - W, com U = Cv T (Cv constante). Etapa I: isotérmica, T2=T1. Etapa II: adiabática, Q2=0. Logo ΔU2 = Cv(T3-T1) = -W2 ⇒ W2 = -Cv(T3-T1) = Cv(T1-T3). Etapa III: isotérmica, T4=T3. Etapa IV: adiabática, Q4=0. Logo ΔU4 = Cv(T1-T3) = -W4 ⇒ W4 = -Cv(T1-T3) = Cv(T3-T1). Portanto, W2 + W4 = Cv(T1-T3) + Cv(T3-T1) = 0. Assim: Wtot = W1+W2+W3+W4 = W1+W3+(W2+W4) = W1+W3. Como se queria demonstrar. Need final line "Resposta final: a) ...; b) Wtot = W1 + W3." The user asked "Termine com uma linha neste formato: Resposta final: <o resultado de cada item, de forma curta>". So final line should include both items. Let's ensure no extra after final. Need answer in Portuguese. Could include "a) gráfico descrito acima..." But final line short. Let's maybe include a simple ASCII graph? Might be too much. The prompt says "esboce o gráfico" but in text answer, describing is okay. However, maybe to be safe, we can include a small schematic in words. Since it's an exam, a drawing is expected, but text description sufficient. Let's maybe format: a) Esboço: ... Maybe include coordinates: 1 (V1,P1); 2 (V2,P2); 3 (V3,P3); 4 (V4,P4). Curvas: I: 1→2, isoterma T1, côncava? Actually PV=const, convexa? In P-V, isotherm is convex? P = nRT/V, second derivative positive? dP/dV=-P/V; d²P/dV²=2P/V²>0, convex (upward). Adiabatic P = C V^{-γ}, d²P/dV² = γ(γ+1) C V^{-γ-2} >0, also convex but steeper. So both convex. Maybe note "As curvas I e III são hipérboles equiláteras; II e IV são curvas adiabáticas, mais inclinadas que as isotermas." Let's final.
a) Esboço do gráfico P \times V:

  • Eixos: P na ordenada e V na abscissa.
  • Estados:
    1=(V_1,P_1,T_1); 2=(V_2,P_2,T_1); 3=(V_3,P_3,T_3); 4=(V_4,P_4,T_3).
  • Etapa I: compressão isotérmica lenta 1 \to 2, com V_2<V_1, P_2>P_1, T_2=T_1. Curva PV=\text{cte}.
  • Etapa II: compressão adiabática rápida 2 \to 3, com V_3<V_2, P_3>P_2, T_3>T_1. Curva adiabática, mais inclinada que a isoterma.
  • Etapa III: expansão isotérmica lenta 3 \to 4, com V_4>V_3, P_4<P_3, T_4=T_3. Curva PV=\text{cte}.
  • Etapa IV: expansão adiabática rápida 4 \to 1, com V_1>V_4, P_1<P_4, retornando a T_1. Curva adiabática.

O ciclo é percorrido no sentido 1 \to 2 \to 3 \to 4 \to 1. As etapas II e IV são adiabáticas (Q=0); as etapas I e III são isotérmicas.

b) Pela Primeira Lei da Termodinâmica, para 1 mol de gás ideal:

\Delta U=Q-W

onde W é o trabalho realizado pelo gás. Para gás ideal, \Delta U=C_V\Delta T.

  • Etapa II: adiabática, Q_2=0. Como T_2=T_1 e T_3 é a temperatura final:
\Delta U_2=C_V(T_3-T_1)=-W_2
W_2=-C_V(T_3-T_1)=C_V(T_1-T_3)
  • Etapa IV: adiabática, Q_4=0. Como T_4=T_3 e T_1 é a temperatura final:
\Delta U_4=C_V(T_1-T_3)=-W_4
W_4=-C_V(T_1-T_3)=C_V(T_3-T_1)

Portanto:

W_2+W_4=C_V(T_1-T_3)+C_V(T_3-T_1)=0

Assim, o trabalho total no ciclo é:

W_{\text{tot}}=W_1+W_2+W_3+W_4
W_{\text{tot}}=W_1+W_3+(W_2+W_4)
W_{\text{tot}}=W_1+W_3

Como se queria demonstrar.

Resposta final: a) gráfico P\times V com 1\to2 isoterma de compressão, 2\to3 adiabática de compressão, 3\to4 isoterma de expansão e 4\to1 adiabática de expansão; b) W_{\text{tot}}=W_1+W_3.

Gemini 3.8 Flash

Respondeu · diferente da resposta de referência dos cursinhos

a) O gráfico P \times V corresponde a um ciclo de Carnot percorrido em sentido anti-horário entre as isotermas T_1 e T_3 (T_3 > T_1), com as etapas: I (compressão isotérmica a T_1, 1 \to 2), II (compressão adiabática, 2 \to 3), III (expansão isotérmica a T_3, 3 \to 4) e IV (expansão adiabática, 4 \to 1). b) Como as etapas II e IV são adiabáticas (Q = 0), W_2 = -C_v(T_3 - T_1) e W_4 = -C_v(T_1 - T_3) = C_v(T_3 - T_1), de modo que W_2 + W_4 = 0, resultando em W_{\text{tot}} = W_1 + W_3.

levou 34 s

Como pensou
**Analyzing Initial State** I'm focusing on the early stages of this IME 2026/2027 Chemistry problem. I've begun by carefully reading the prompt, specifically noting that it concerns one mole of an ideal gas in an initial state. This sets the foundation for the subsequent analysis. **Mapping Process Stages** I'm now mapping out the distinct stages of the thermodynamic cycle. I've identified four key steps: a slow, isothermal compression; a rapid compression; a slow, isothermal expansion; and finally, a rapid expansion returning to the initial state. This cyclical nature is crucial for the subsequent analysis. **Confirming Process Type** I've confirmed that stages II and IV are adiabatic processes based on the problem statement's description of rapid, heatless transitions. This means that during the adiabatic compression, volume decreases and pressure increases, leading to a temperature rise. The subsequent adiabatic expansion will then lower the temperature back to the initial state. **Identifying Carnot Cycle** The described sequence of isothermal and adiabatic steps, particularly the completion of the cycle by returning to the initial temperature and pressure, strongly suggests that I am working with a Carnot cycle. I am currently verifying the directionality of this cycle to ensure accurate application of thermodynamic principles. **Confirming Cycle Direction** I've confirmed the cycle is indeed reversed, operating counter-clockwise as a refrigeration cycle. This means stage I is isothermal compression at $T_1$, followed by adiabatic compression to $T_3$, then isothermal expansion at $T_3$, and finally adiabatic expansion back to $T_1$. **Drawing P-V Graph** I'm now visualizing the $P \times V$ graph. I'm plotting pressure on the vertical axis and volume on the horizontal. I'm marking the four points and showing the isothermal and adiabatic processes connecting them, with arrows indicating the counter-clockwise direction of the reversed refrigeration cycle. **Calculating Adiabatic Work** I'm calculating the work done during the adiabatic stages (II and IV). Using the first law of thermodynamics, I've established that for these heatless processes, the change in internal energy is directly related to the work done. For an ideal gas, internal energy depends solely on temperature, allowing for calculation based on the temperature change in each adiabatic step. **Verifying Adiabatic Work** I've confirmed that the work done during the adiabatic compression and expansion cancels out. This is because the internal energy change, and thus the work, in the adiabatic stages are equal in magnitude but opposite in sign, regardless of the sign convention for work used in the First Law. **Calculating Adiabatic Work** I'm now calculating the work done during the adiabatic stages (II and IV). Based on the First Law of Thermodynamics and the fact that these are adiabatic processes ($Q=0$), the work done is directly equal to the negative change in internal energy ($W = -\Delta U$). Since internal energy for an ideal gas depends only on temperature, I'm using the temperature changes in these steps to quantify the work. **Verifying Adiabatic Work** I've confirmed that the work done during the adiabatic compression and expansion cancels out. This is because the internal energy change, and thus the work, in the adiabatic stages are equal in magnitude but opposite in sign, regardless of the sign convention for work used in the First Law. **Calculating Total Work** I've confirmed that the total work is simply the sum of the work done during the isothermal stages, as the adiabatic work cancels out. This conclusion holds true regardless of whether the adiabatic steps are reversible, relying only on the adiabatic nature, ideal gas properties, and the first law of thermodynamics. **Sketching P-V Graph** I am now focusing on sketching the P-V diagram. I will clearly label the pressure and volume axes, then depict the two isotherms and the connecting adiabatic curves. I'll indicate the four states and the counter-clockwise direction of the cycle with arrows for accurate representation. **Visualizing P-V Diagram** I am now focusing on creating a clear textual representation of the P-V diagram. I will meticulously label the axes and clearly delineate the isotherms, adiabatic curves, and the four states with their corresponding pressures and volumes, indicating the cycle's counter-clockwise direction. **Calculating Isothermal Work** I am now calculating the work done during the isothermal processes. For stage I, work is done *on* the gas during compression, meaning $W_I$ is negative. For stage III, work is done *by* the gas during expansion, so $W_{III}$ is positive. I am applying the formula $W = nRT \ln(V_f/V_i)$. **Calculating Isothermal Work** I am now calculating the work done during the isothermal processes. For stage I, work is done *on* the gas during compression, meaning $W_I$ is negative. For stage III, work is done *by* the gas during expansion, so $W_{III}$ is positive. I am applying the formula $W = nRT \ln(V_f/V_i)$. **Finalizing Work Calculations** I've confirmed that the total work is indeed the sum of the work done during the isothermal stages, as the adiabatic work cancels out. My calculations for both isothermal and adiabatic work are consistent across different approaches, reinforcing the correctness of the final result for total work. **Generating P-V Diagram** I am now meticulously creating the P-V diagram. I will clearly label the axes, depict the two isotherms and the connecting adiabatic curves, and accurately mark the four states with arrows indicating the counter-clockwise direction of the cycle. This visual representation will be thorough and informative.

Item a)

Análise das Etapas do Ciclo:

  1. Etapa I (1 \to 2): Compressão isotérmica lenta à temperatura T_1

    • O gás vai de (P_1, V_1, T_1) até (P_2, V_2, T_1), com V_2 < V_1 e P_2 > P_1.
    • A trajetória segue a isoterma de menor temperatura (T_1).
  2. Etapa II (2 \to 3): Compressão adiabática muito rápida

    • Por ser muito rápida, não há troca de calor (Q_2 = 0).
    • A compressão realiza trabalho sobre o gás, elevando sua temperatura de T_1 até T_3 (T_3 > T_1), com V_3 < V_2 e P_3 > P_2.
    • A curva adiabática possui inclinação mais acentuada que a isoterma \left(\left|\frac{dP}{dV}\right|_{\text{adiab}} = \gamma \frac{P}{V} > \left|\frac{dP}{dV}\right|_{\text{isot}} = \frac{P}{V}\right).
  3. Etapa III (3 \to 4): Expansão isotérmica lenta à temperatura T_3

    • O gás se expande de (P_3, V_3, T_3) até (P_4, V_4, T_3), com V_4 > V_3 e P_4 < P_3.
    • A trajetória segue a isoterma de maior temperatura (T_3).
  4. Etapa IV (4 \to 1): Expansão adiabática muito rápida de volta ao estado inicial

    • Não há troca de calor (Q_4 = 0).
    • O gás se expande realizando trabalho, de modo que sua temperatura diminui de T_3 até T_1, retornando ao ponto inicial (P_1, V_1, T_1).
    • O ciclo é percorrido no sentido anti-horário (ciclo de Carnot reverso / ciclo de refrigeração).

Esboço do Gráfico P \times V:

    P ^
      |
  P3  |            3 (P3, V3, T3)
      |           / \
      |   Etapa  /   \  Etapa III (Isotérmica, T3)
      |    II   /     \
  P4  |  (Ad.) /       \  4 (P4, V4, T3)
      |       /         \
  P2  |      2           \   Etapa IV (Adiabática)
      |       \           \
      | Etapa  \           \
      |   I     \           \
  P1  |  (Isot.) \___________1 (P1, V1, T1)
      |
      +-------+-----+---+-----+------------>
      0      V3    V2  V4    V1            V
  • Identificação das etapas e sentidos:
    • Etapa I (1 \to 2): Compressão isotérmica à temperatura T_1 (seta de 1 para 2).
    • Etapa II (2 \to 3): Compressão adiabática (Q = 0) de T_1 para T_3 (seta de 2 para 3).
    • Etapa III (3 \to 4): Expansão isotérmica à temperatura T_3 (seta de 3 para 4).
    • Etapa IV (4 \to 1): Expansão adiabática (Q = 0) de T_3 para T_1 (seta de 4 para 1).

Item b)

Pela Primeira Lei da Termodinâmica:

\Delta U = Q - W

onde \Delta U é a variação da energia interna do gás, Q é o calor trocado e W é o trabalho realizado pelo sistema.

Para um gás ideal, a energia interna depende exclusivamente da temperatura:

\Delta U = n C_v \Delta T

Como n = 1\text{ mol}:
\Delta U = C_v \Delta T

O enunciado afirma que as etapas II e IV são muito rápidas, não havendo tempo para a troca de calor com a vizinhança. Portanto, ambas são processos adiabáticos:

Q_2 = 0 \quad \text{e} \quad Q_4 = 0

Aplicando a Primeira Lei da Termodinâmica para as etapas II e IV:

  • Para a Etapa II (2 \to 3):

    \Delta U_2 = Q_2 - W_2 = -W_2

    W_2 = -\Delta U_2 = -C_v (T_3 - T_1)

  • Para a Etapa IV (4 \to 1):

    \Delta U_4 = Q_4 - W_4 = -W_4

    W_4 = -\Delta U_4 = -C_v (T_1 - T_3) = C_v (T_3 - T_1)

Somando o trabalho das etapas II e IV:

W_2 + W_4 = -C_v (T_3 - T_1) + C_v (T_3 - T_1) = 0

\implies W_2 = -W_4

O trabalho total realizado no ciclo completo é a soma algébrica dos trabalhos de todas as quatro etapas:

W_{\text{tot}} = W_1 + W_2 + W_3 + W_4

Substituindo W_2 + W_4 = 0:

W_{\text{tot}} = W_1 + W_3


Resposta final:
a) O gráfico P \times V corresponde a um ciclo de Carnot percorrido em sentido anti-horário entre as isotermas T_1 e T_3 (T_3 > T_1), com as etapas: I (compressão isotérmica a T_1, 1 \to 2), II (compressão adiabática, 2 \to 3), III (expansão isotérmica a T_3, 3 \to 4) e IV (expansão adiabática, 4 \to 1).
b) Como as etapas II e IV são adiabáticas (Q = 0), W_2 = -C_v(T_3 - T_1) e W_4 = -C_v(T_1 - T_3) = C_v(T_3 - T_1), de modo que W_2 + W_4 = 0, resultando em W_{\text{tot}} = W_1 + W_3.

Gemini 4 Argon

Respondeu · bate com a resposta de referência dos cursinhos

a) Ciclo fechado no diagrama P x V percorrido no sentido horário, limitado por duas curvas isotermas (etapas I em T1 e III em T3, com T3 > T1) e duas curvas adiabáticas mais inclinadas (etapas II e IV), com V3 < V2 e V3 < V4 < V1; b) Demonstração concluída a partir de ΔU_ciclo = 0, ΔU_1 = ΔU_3 = 0 (isotérmicas de gás ideal) e Q_2 = Q_4 = 0 (adiabáticas), resultando em W_2 + W_4 = 0 e W_tot = W_1 + W_3.

levou 40 s

Como pensou
**Analyzing Chemistry Problem** I am currently processing the initial details of the chemistry exam question, focusing on understanding the constraints and parameters of the ideal gas system described. My immediate goal is to fully grasp the scenario presented before proceeding to any calculations. **Visualizing the Gas Cycle** I'm now focusing on sketching the P-V diagram. I've identified the isothermal compressions and expansions, and I'm considering how to represent the rapid, likely adiabatic, changes of state. I need to ensure the transitions accurately reflect the described pressure and volume shifts. **Mapping Cycle States** I've now precisely defined each of the four states in the thermodynamic cycle. I'm confirming the relationships between their pressures, volumes, and temperatures, paying close attention to the order of operations: isothermal compression to adiabatic compression, followed by isothermal expansion and then adiabatic expansion, returning to the initial state. **Confirming Adiabatic Transitions** I'm now solidifying my understanding of the adiabatic steps. I've confirmed that the transitions between the isotherms are indeed steeper than the isothermal segments, accurately reflecting the rapid pressure and volume changes without heat transfer. I'm cross-referencing the work calculations for these stages. **Calculating Adiabatic Work** I'm now focusing on the work done during the adiabatic processes. I've confirmed that the change in internal energy for these steps directly equals the work performed, and that the work done during the two adiabatic stages cancels out over the entire cycle, which is a critical check.

a) Esboço do gráfico P \times V:

Para construir o diagrama de Clapeyron (P \times V), analisamos o comportamento das variáveis de estado em cada uma das quatro etapas para 1 mol de gás ideal (PV = RT):

  1. Etapa I (1 \to 2, compressão isotérmica a T_1): Como a temperatura T_1 é constante e ocorre uma compressão, o volume diminui (V_2 < V_1) e a pressão aumenta (P_2 > P_1) seguindo uma hipérbole equilátera (P \cdot V = RT_1 = \text{constante}).
  2. Etapa II (2 \to 3, compressão adiabática de T_1 a T_3): Por ser muito rápida, não há troca de calor (Q_2 = 0). Na compressão adiabática, o volume continua diminuindo (V_3 < V_2), a pressão aumenta de forma mais acentuada do que na isoterma (P_3 > P_2) e a temperatura do gás se eleva (T_3 > T_1).
  3. Etapa III (3 \to 4, expansão isotérmica a T_3): Mantendo a temperatura T_3 constante, o gás se expande (V_4 > V_3) e a pressão diminui (P_4 < P_3) ao longo de uma isoterma superior à da Etapa I (pois T_3 > T_1).
  4. Etapa IV (4 \to 1, expansão adiabática de T_3 a T_1): Novamente sem troca de calor (Q_4 = 0), o gás se expande (V_1 > V_4) com queda acentuada de pressão (P_1 < P_4) e resfriamento de T_3 de volta a T_1, fechando o ciclo no sentido horário.

Representação esquemática do diagrama P \times V:

    P ^
      |
  P3 -|       (3)
      |        |\ 
      |        |  \   Etapa III (Isotérmica, T3)
      |        |    \
  P4 -|   Etapa|      (4)
      |    II  |        \
  P2 -|       (2)         \  Etapa IV
      |          \          \ (Adiabática)
      |   Etapa I  \          \
  P1 -| (Isot., T1)  `--(1)----`
      |
      +--------+--+------+-----+----> V
              V3 V2     V4    V1

b) Demonstração para o trabalho total (W_{\text{tot}}):

O trabalho total realizado no ciclo é dado pela soma algébrica dos trabalhos de cada uma das quatro etapas:

W_{\text{tot}} = W_1 + W_2 + W_3 + W_4

Pela Primeira Lei da Termodinâmica, a variação da energia interna (\Delta U) em uma etapa qualquer é dada por (adotando a convenção \Delta U = Q + W):

\Delta U_i = Q_i + W_i

Como a energia interna U é uma função de estado, a variação total de energia interna ao final de um ciclo fechado é nula:

\Delta U_{\text{tot}} = \Delta U_1 + \Delta U_2 + \Delta U_3 + \Delta U_4 = 0

Para um gás ideal, a energia interna depende exclusivamente da temperatura (U = U(T)). Analisando as etapas isotérmicas (I e III):

  • Etapa I: T_2 = T_1 \implies \Delta U_1 = 0
  • Etapa III: T_4 = T_3 \implies \Delta U_3 = 0

Substituindo na equação do ciclo:

\Delta U_2 + \Delta U_4 = 0

Analisando agora as etapas rápidas (II e IV), o enunciado informa que não há troca de calor entre o sistema e o ambiente (processos adiabáticos), logo:

  • Etapa II: Q_2 = 0 \implies \Delta U_2 = W_2
  • Etapa IV: Q_4 = 0 \implies \Delta U_4 = W_4

(Nota: Caso se adote a convenção \Delta U = Q - W, tem-se \Delta U_2 = -W_2 e \Delta U_4 = -W_4, o que conduz ao mesmo resultado).

Substituindo as relações das etapas adiabáticas na soma das variações de energia interna:

W_2 + W_4 = 0 \implies W_4 = -W_2

Por fim, substituindo W_2 + W_4 = 0 na expressão do trabalho total do ciclo:

W_{\text{tot}} = W_1 + W_3 + (W_2 + W_4) \implies W_{\text{tot}} = W_1 + W_3

Resposta final: a) Ciclo fechado no diagrama P x V percorrido no sentido horário, limitado por duas curvas isotermas (etapas I em T1 e III em T3, com T3 > T1) e duas curvas adiabáticas mais inclinadas (etapas II e IV), com V3 < V2 e V3 < V4 < V1; b) Demonstração concluída a partir de ΔU_ciclo = 0, ΔU_1 = ΔU_3 = 0 (isotérmicas de gás ideal) e Q_2 = Q_4 = 0 (adiabáticas), resultando em W_2 + W_4 = 0 e W_tot = W_1 + W_3.