PRÁTICA COM QUESTÕES OFICIAIS
Questão 12 da Santa Casa 2025
Leia o texto e examine o gráfico para responder às questões de 11 a 17. · Conhecimentos Gerais
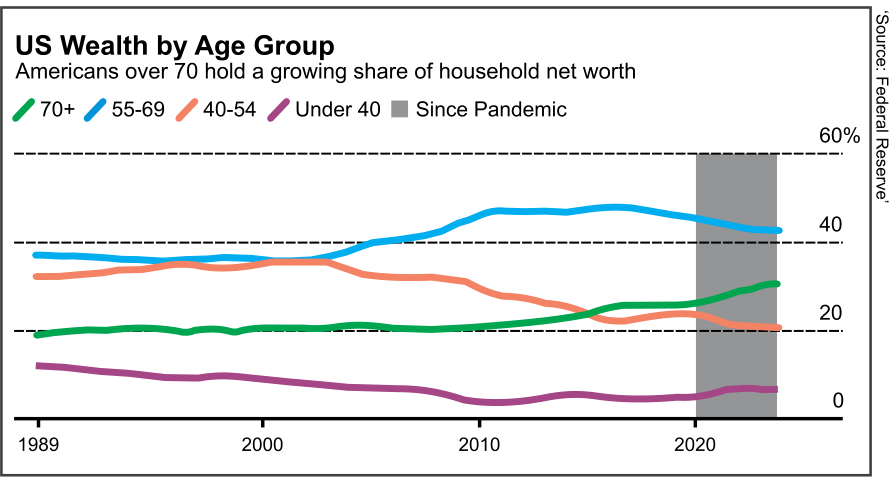
Most don’t work anymore, but Americans age 70 and older have seen their share of collective wealth surge during the pandemic. As a group, they have accumulated more than $14 trillion in additional net worth since the end 2019, based on Federal Reserve data. Their share of the country’s wealth has jumped to a record 30%, even though they account for 11% of the population.
The aging population helps explain some of the gains: there are about 2.3 million more people over 70 in the country than in 2019. But one major driver was the surge in home values and stocks during the pandemic, which benefited older generations most likely to own a house — or two — and hold equities or mutual funds.
Although people who are over 70 are typically retired, a rising portion of that age group is still working. The share of adults age 65 and more in the labor force reached a historic low of 10% in the mid-1980s but has since almost doubled, even after many retired early at the onset of the covid-19 health crisis.
Older Americans also have been the beneficiaries of good timing with the stock market, despite recessions along the way. Since 2019, those age 70 and older have collectively gained about $5 trillion in equity gains. Close to 38% of the nation’s corporate equities and mutual fund shares were held by people in that age group, the highest share on record in data going back to 1989.
(Alex Tanzi. www.bnnbloomberg.ca, 2023. Adaptado.)
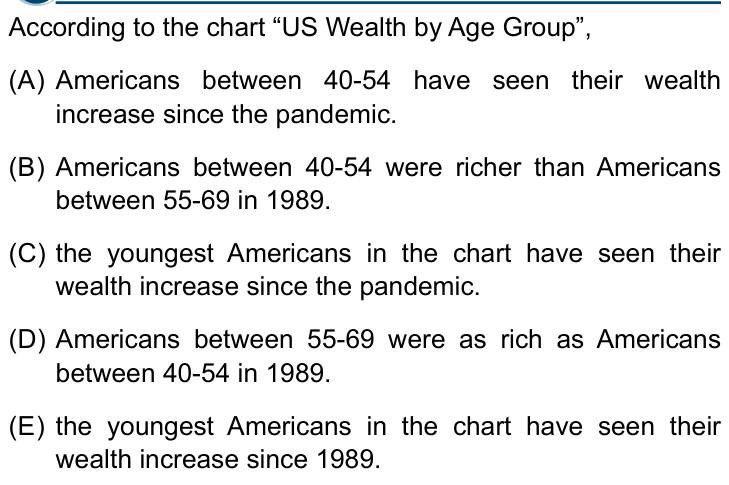
According to the chart “US Wealth by Age Group”,
- AAmericans between 40-54 have seen their wealth increase since the pandemic.
- BAmericans between 40-54 were richer than Americans between 55-69 in 1989.
- Cthe youngest Americans in the chart have seen their wealth increase since the pandemic.
- DAmericans between 55-69 were as rich as Americans between 40-54 in 1989.
- Ethe youngest Americans in the chart have seen their wealth increase since 1989.
Você já respondeu questões neste aparelho. Crie sua conta grátis para guardar o histórico e refazer as que errou.
Resposta salva no seu histórico.
Reportar erro na questão
Resolução comentada
A questão pede o que o gráfico mostra: a porcentagem da riqueza líquida total das famílias dos EUA detida por cada faixa etária. O ponto central é ler a posição de cada linha no ano indicado e comparar o começo com o fim do período.
-
Em 1989, a linha azul (55-69) está em cerca de 35%, e a laranja (40-54) em cerca de 31%. Logo, os de 55-69 tinham fatia maior. Isso derruba B e D, que dizem que os de 40-54 eram mais ricos ou igualmente ricos.
-
Os mais jovens são a linha roxa (Under 40). Em 1989 ela está em cerca de 10%; no fim do gráfico, em cerca de 4-5%. A fatia caiu desde 1989, então E está errada.
-
Na área cinza (desde a pandemia, a partir de 2020), a linha roxa sobe um pouco: de cerca de 3% para cerca de 5%. Portanto, a fatia dos mais jovens aumentou desde a pandemia, e C está certa.
-
A linha laranja (40-54), na mesma área cinza, cai de cerca de 22% para cerca de 20%. Ela diminuiu, e A está errada.
A única afirmação coerente com o gráfico é a de que os mais jovens aumentaram sua fatia desde a pandemia.
Alternativa C.
Pegadinha: A alternativa E engana ao trocar o ponto de comparação: o grupo mais jovem subiu desde a pandemia (C), mas caiu desde 1989 (E).
Por que as outras alternativas estão erradas
- AA linha laranja (40-54) cai de cerca de 22% para 20% na área da pandemia, não sobe.
- BEm 1989 os de 40-54 (cerca de 31%) tinham fatia menor que os de 55-69 (cerca de 35%).
- DAs linhas não coincidem em 1989: a azul (55-69) está acima da laranja (40-54).
- EUnder 40 passou de cerca de 10% em 1989 para cerca de 4-5%, ou seja, diminuiu.
Assunto: Anúncios, cartazes e infográficos.
Reportar erro na resolução
Ver como caiu na prova
Fonte: Santa Casa 2025 · Conhecimentos Gerais. Prova oficial ↗