Questão 29 da UNESP 2026
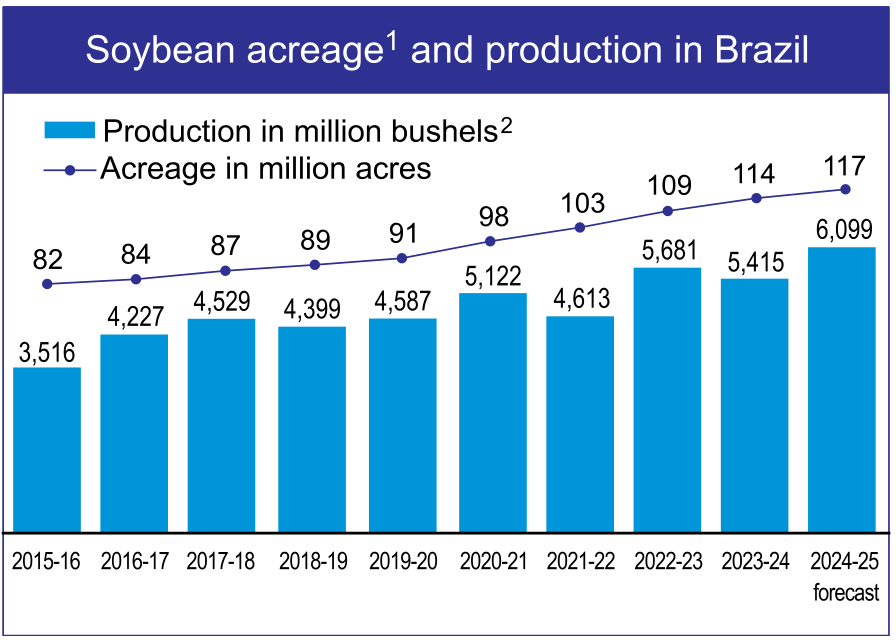
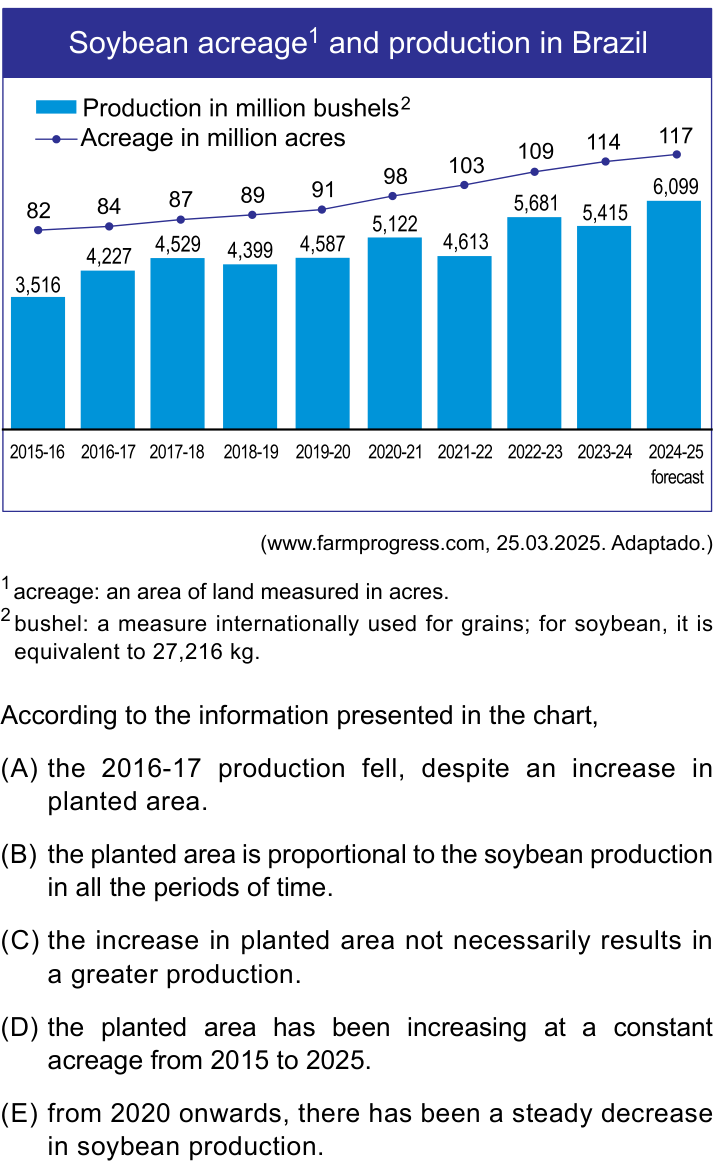
(www.farmprogress.com, 25.03.2025. Adaptado.)
1 acreage: an area of land measured in acres.
2 bushel: a measure internationally used for grains; for soybean, it is equivalent to 27,216 kg.
According to the information presented in the chart,
- Athe 2016-17 production fell, despite an increase in planted area.
- Bthe planted area is proportional to the soybean production in all the periods of time.
- Cthe increase in planted area not necessarily results in a greater production.
- Dthe planted area has been increasing at a constant acreage from 2015 to 2025.
- Efrom 2020 onwards, there has been a steady decrease in soybean production.
Reportar erro na questão
Ver como caiu na prova
Fonte: UNESP 2026 · Conhecimentos Gerais. Prova oficial ↗