PRÁTICA COM QUESTÕES OFICIAIS
Questão 22 (1ª fase) da UNESP 2022
Examine os gráficos e leia o texto para responder às questões de 21 a 27. · Conhecimentos Gerais
Educated Americans live longer, as others die younger
Catching up, falling behind
United States, average life expectancy at age 25
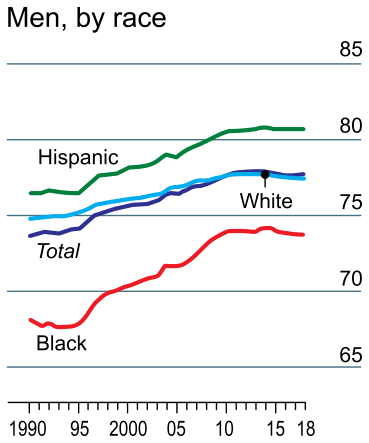
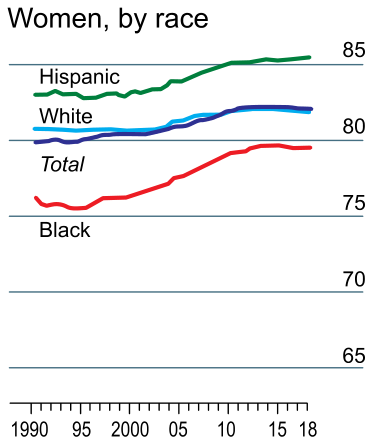
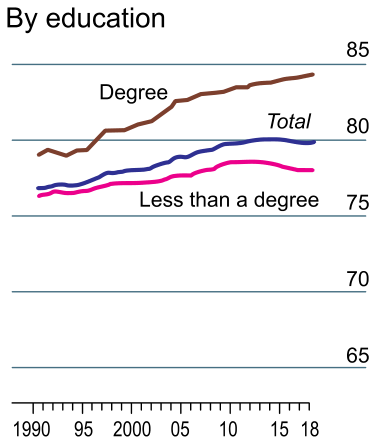
(Anne Case and Angus Deaton. “Life expectancy in adulthood is falling for those without a BA degree, but as educational gaps have widened, racial gaps have narrowed”. PNAS, 2021. Adaptado.)
A 25-year-old American with a university degree can expect to live almost a decade longer than a contemporary who dropped out of high school. Although researchers have long known that the rich live longer than the poor, this education gap is less well documented — and is especially marked in rich countries. And whereas the average American’s expected span has been flat in recent years — and, strikingly, even fell between 2015 and 2017 — that of the one-third with a bachelor’s degree has continued to lengthen.
This disparity in life expectancy is growing, according to new research published in the Proceedings of the National Academy of Sciences. Using data from nearly 50m death certificates filed between 1990 and 2018, Anne Case and Angus Deaton of Princeton University analysed differences in life expectancy by sex, race, ethnicity and education. They found that the lifespans of those with and without a bachelor’s degree started to diverge in the 1990s and 2000s. This gap grew even wider in the 2010s as the life expectancy of degree-holders continued to rise while that of other Americans got shorter.
What is the link between schooling and longevity? Some argue that better-educated people develop healthier lifestyles: each additional year of study reduces the chances of being a smoker and of being overweight. The better-educated earn more, which in turn is associated with greater health. Ms Case and Mr Deaton argue that changes in labour markets, including the rise of automation and increased demand for highly-educated workers, coupled with the rising costs of employer-provided health care, have depressed the supply of well-paid jobs for those without a degree. This may be contributing to higher rates of alcohol and drug use, suicide and other “deaths of despair”.
(www.economist.com,17.03.2021. Adaptado.)
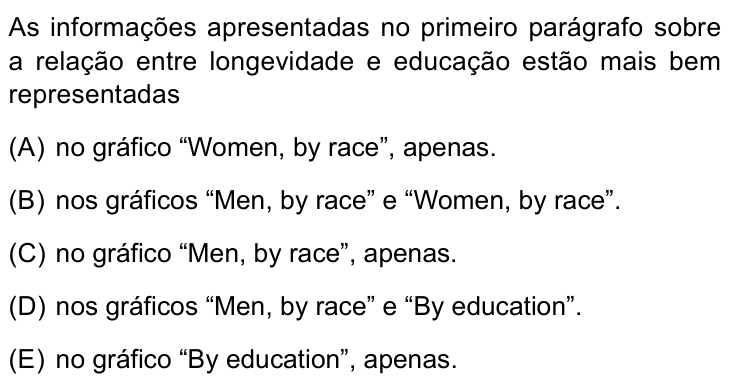
As informações apresentadas no primeiro parágrafo sobre a relação entre longevidade e educação estão mais bem representadas
- Ano gráfico “Women, by race”, apenas.
- Bnos gráficos “Men, by race” e “Women, by race”.
- Cno gráfico “Men, by race”, apenas.
- Dnos gráficos “Men, by race” e “By education”.
- Eno gráfico “By education”, apenas.
Você já respondeu questões neste aparelho. Crie sua conta grátis para guardar o histórico e refazer as que errou.
Resposta salva no seu histórico.
Reportar erro na questão
Resolução comentada
O primeiro parágrafo trata de educação e longevidade. Ele diz três coisas: (1) quem tem diploma universitário vive quase uma década a mais que quem abandonou o ensino médio; (2) a expectativa de vida média do americano ficou estável nos últimos anos e até caiu entre 2015 e 2017; (3) a expectativa de quem tem bacharelado continuou aumentando.
O critério de comparação do texto é o nível de escolaridade, não raça nem sexo. Só um gráfico traz essa variável: o "By education".
Conferindo nele:
- A linha "Degree" fica no topo, perto de 84 anos em 2018. A linha "Less than a degree" fica perto de 78. A diferença visual é grande, coerente com a ideia de uma lacuna educacional.
- A linha "Total" fica quase plana após 2010 e tem leve queda no fim, como o texto afirma sobre a média do país.
- A linha "Degree" sobe continuamente até 2018.
Já os gráficos "Men, by race" e "Women, by race" comparam grupos raciais e étnicos (hispânicos, brancos e negros). Eles não mostram escolaridade, então não representam o conteúdo do parágrafo.
Portanto, só o gráfico "By education" ilustra bem o parágrafo.
Alternativa E.
Por que as outras alternativas estão erradas
- AO gráfico das mulheres separa por raça, não por escolaridade, e não ilustra o parágrafo.
- BOs dois gráficos por raça não trazem a variável educação, que é o foco do parágrafo.
- CO gráfico dos homens compara raças e deixa de lado o gráfico que mostra escolaridade.
- DInclui corretamente o gráfico de educação, mas junta a ele o dos homens por raça, que não trata do tema.
Assuntos: Anúncios, cartazes e infográficos, Informações explícitas e detalhes.
Reportar erro na resolução
Ver como caiu na prova
Fonte: UNESP 2022 · Conhecimentos Gerais. Prova oficial ↗